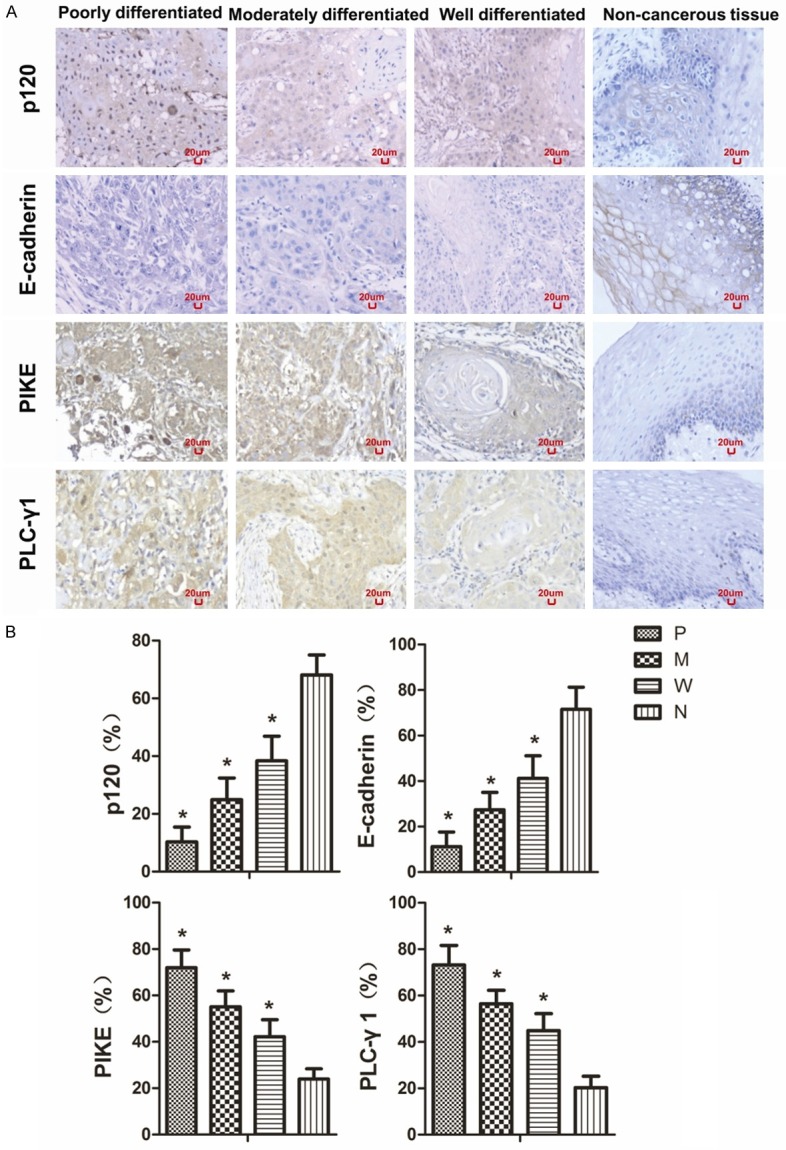
Figure 1.

The expression levels of p120, E-cadherin, PIKE, and PLC-γ1 protein in OSCC with different levels of differentiation. Positive expression is shown in brown and the counterstaining is shown in blue. The representative section shows the average levels of p120, E-cadherin, PIKE, and PLC-γ1 in poorly differentiated, moderately differentiated, well differentiated OSCC, and adjacent non-cancerous tissue (A). The expression of p120, E-cadherin, PIKE, and PLC-γ1 levels in poorly differentiated, moderately differentiated, well differentiated OSCC, and non-cancerous tissue is shown as bar graphs (B). The quantitation of positive expression in each section was obtained by counting the number of positive cells and total number of cells in the corresponding region in five representative regions in each section. The proportion of positively staining cells over the total number of cells was calculated as describe in Materials and Methods. The data are expressed as mean ± SD, *P < 0.05 (compared with the normal epithelium). P, poorly differentiated; M, moderately differentiated; W, well differentiated; N, non-cancerous tissue.
