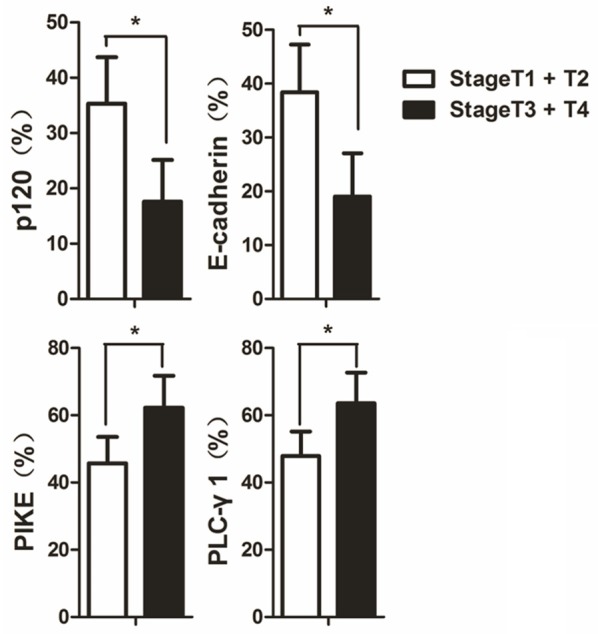
Figure 2.

The expression levels of p120, E-cadherin, PIKE, and PLC-γ1 in OSCC with different clinical stages. The expression levels of p120, E-cadherin, PIKE, and PLC-γ1 in early stage OSCC (stage T1 + T2) and advanced OSCC (stage T3 + T4) are shown as bar graphs. The quantitation was obtained as described in Figure 1. The data are expressed as mean ± SD, *P < 0.05.
