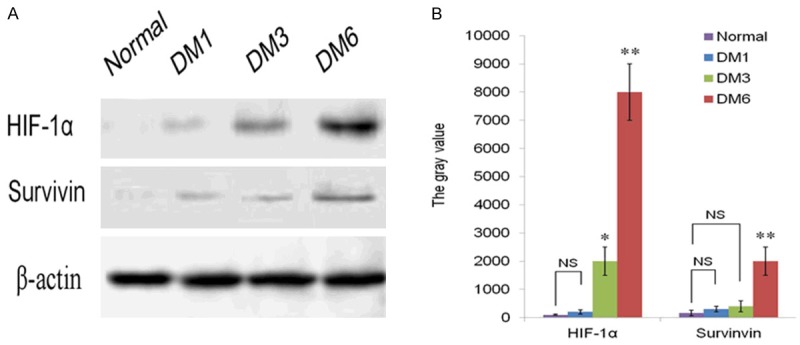
Figure 4.

HIF-1α and Survivin protein levels were detected in the DM1, DM3 and DM6 groups compared to that in the control group. (A) Western Blot shows that HIF-1α and Survivin was barely detected in the control group and DM1, but the expression of HIF-1α was elevated in the DM3 and DM6 groups, the level of Survivin was increased markedly in DM6 group. (B) Quantification of the data in (A) shows the expression intensity of HIF-1α and Survivin. β-actin served as internal control. *P<0.05, **P<0.01 vies to normal group.
