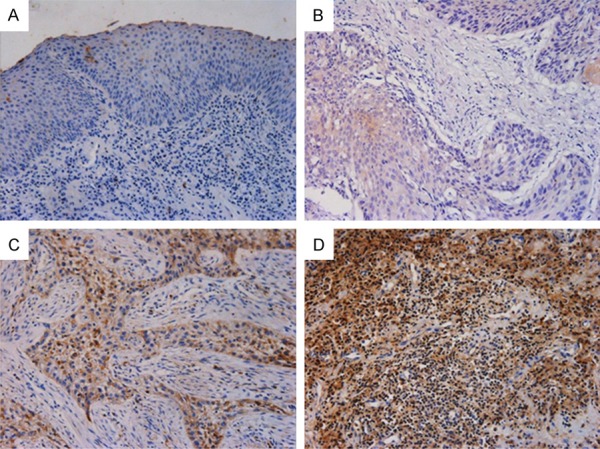
Figure 2.

Representative images of the PXN protein expression in LSCC tissues and their corresponding adjacent non-tumor tissues were detected via immunohistochemical staining. A. Negative staining of PXN in adjacent non-tumor tissues, scored as PXN (-); B. Weak staining of PXN in well-differentiated LSCC tissues, scored as PXN (+); C. Strong staining of PXN in moderate-differentiated LSCC tissues, scored as PXN (++); D. Strong staining of PXN in poor-differentiated LSCC tissues, scored as PXN (+++). Original magnification: 200×.
