
Figure 1.
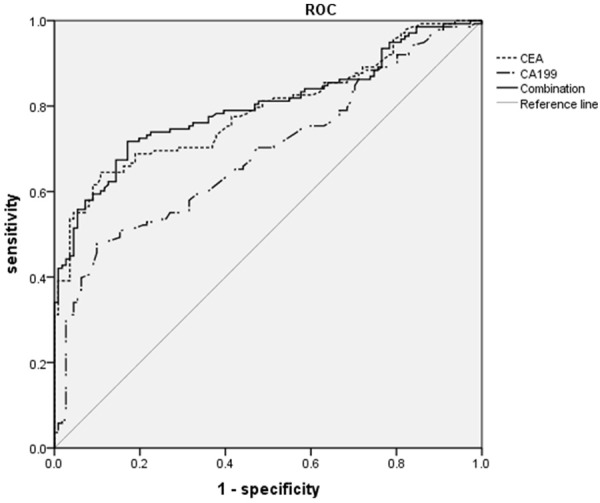
ROC curve comparing CEA and CA 19-9 levels in patients with CRC group versus patients with benign colorectal disease group. The curves show optimal cut-off value for CEA of 3.36 ng/ml and for CA 19-9 of 23.9 U/ml. The area under the ROC curve was 0.789 for CEA, 0.690 for CA 19-9 and 0.799 for the combination of the two tumor markers.