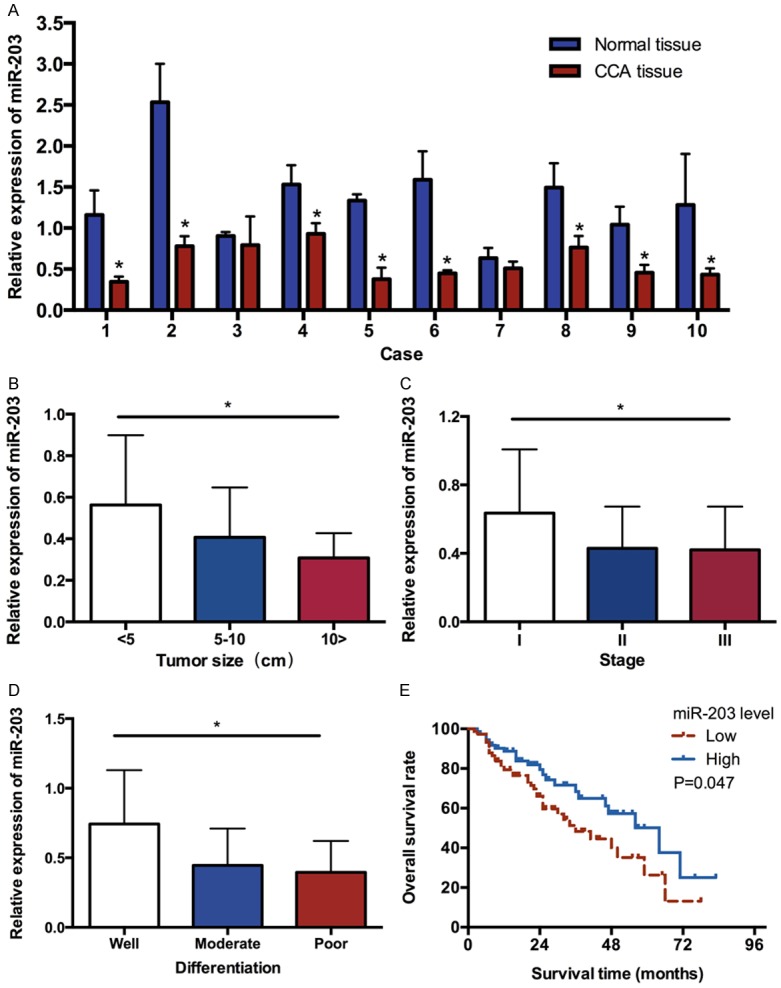
Figure 1.

A. Comparison of miR-203 expression levels between CCA tissues and adjacent normal tissues. B. The expression level of miR-203 in CCA patients at different tumor size. C. The expression level of miR-203 in CCA patients at different clinical stages. D. The expression level of miR-203 at different differentiation of CCA tissues. E. Overall survival curve of CCA patients with different miR-203 expression. The patients with a lower expression of miR-203 had a lower survival time compared with those with a higher expression of miR-203. (*P<0.05).
