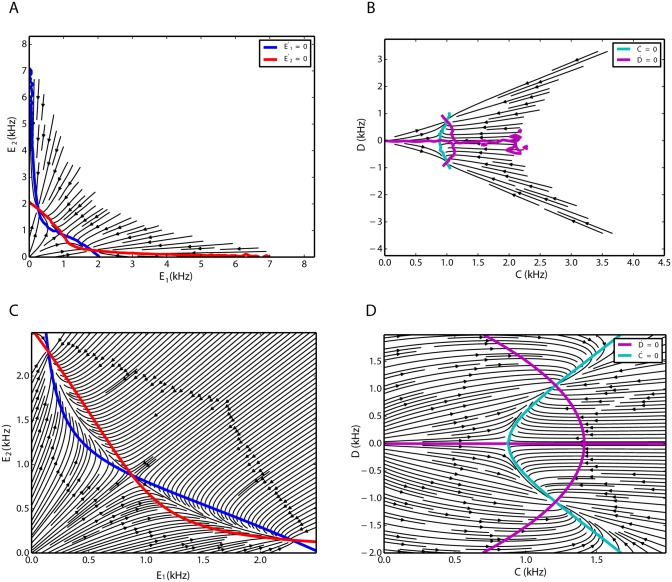
Fig 6. Flow of the two excitatory subnetworks in two dimensions, extracted from simulated time series (top) and inferred from the Lotka-Volterra model (bottom).
A. State space of excitatory-excitatory firing rates extracted from simulations. B. Sum-difference state space extracted from simulations. C. State space of excitatory-excitatory firing rates are inferred from the model. D. Flow of the system in Sum-difference state space inferred from the model.

