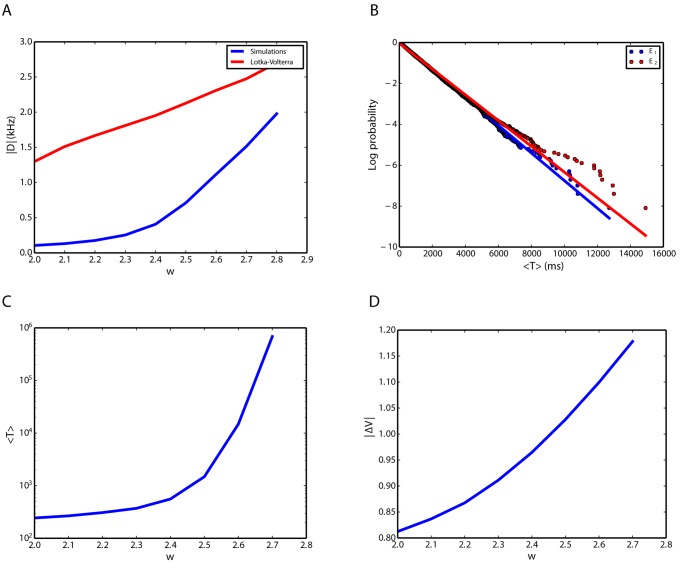
Fig 8. Life time statistics of the winning (high rate) population.
A. Difference between the rates at the stable fixed point as a function of the parameter w that describes the relative strength of synapses within each population. B. Survivor function of the distribution of life times for the two competing excitatory populations. C. Average life time as a function of w for network simulations. D. Difference of energy levels (see text for details) between the attractor and the saddle point of Eq (10), when the inhibitory population firing rate is replaced by the other two dynamical variables, as a function of w.

