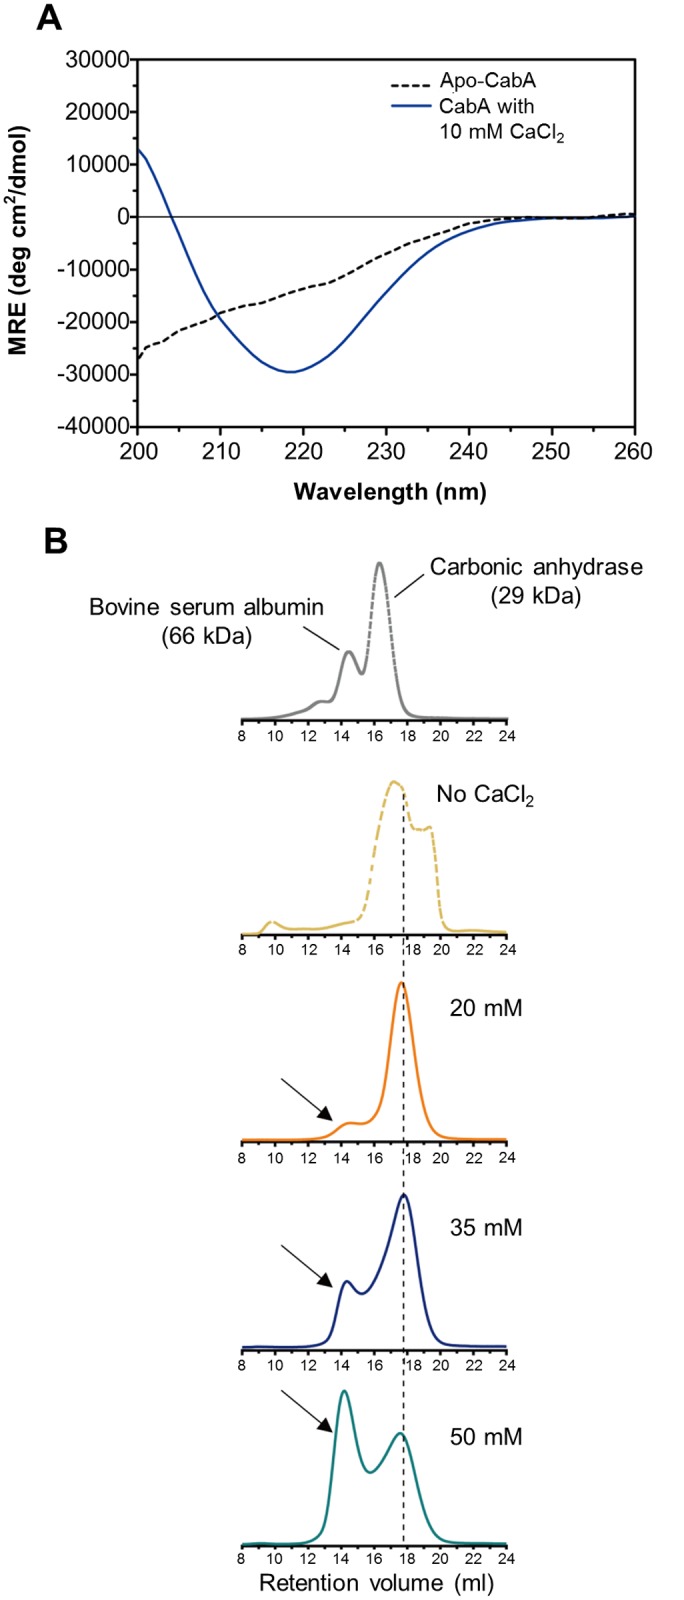
Fig 12. Calcium-induced conformational change and multimerization of CabA.

(A) Typical far-UV CD spectra of CabA in the absence (black dotted line) and presence (blue line) of calcium. MRE, mean residue ellipticity. (B) Calcium-dependent multimerization of CabA was assessed using size-exclusion chromatography. CabA was eluted in the absence (yellow dotted line) and presence of calcium (20 mM, orange line; 35 mM, blue line; 50 mM, green line). The molecular weight standards (gray dotted line), bovine serum albumin (66 kDa) and carbonic anhydrase (29 kDa) are indicated. Elution peaks corresponding to monomeric and multimeric CabA are indicated by a black dashed line and arrows, respectively.
