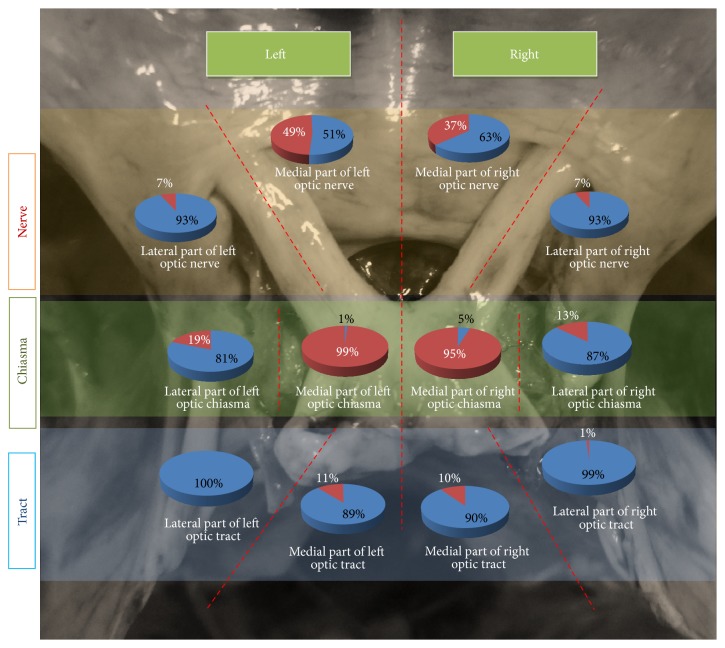
Figure 12.
Illustrated diagram showing relationship of parts of optic neural pathways with FDS in the study sample.The red portion in each pie chart represents the percentage of cases where FDS is related to that particular part of optic pathway. For example, in the top left pie diagram, in 7% of cases, the lateral part of left optic nerve was inferiorly related to FDS.

