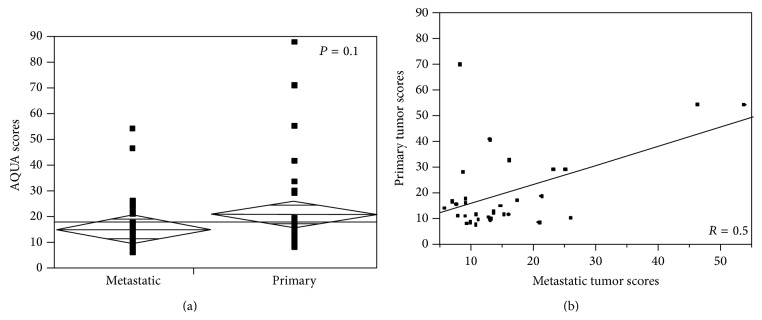
Figure 3.
(a) MET expression levels in metastatic versus primary tumors. t-test was used to compare the means of MET expression (AQUA scores) in matched primary and metastatic specimens from the same patients (P = 0.1). (b) Correlation of MET expression between primary tumor and matched metastases. Pearson correlation test was used to measure the degree of correlation between MET expressions (AQUA scores) in matched primary versus metastatic specimens (R = 0.5).

