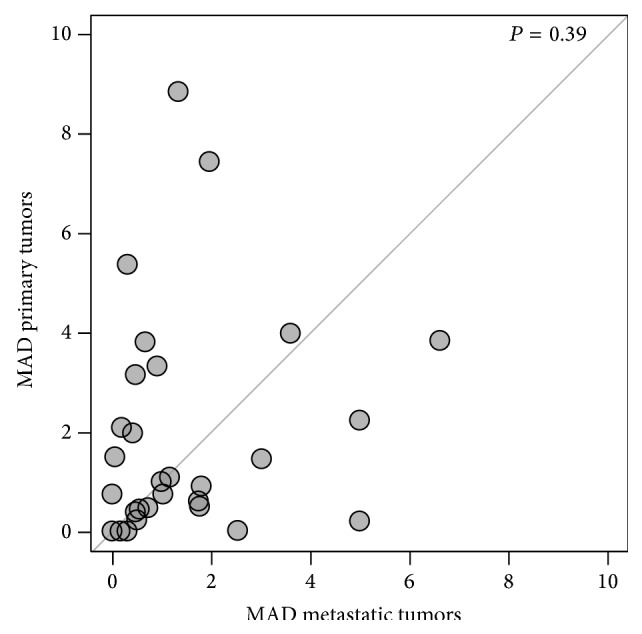
Figure 5.

Assessment of MET staining heterogeneity by MAD score for primary and metastatic lesions. We employed the composite median absolute deviation (MAD) to estimate the heterogeneity within primary and metastatic specimens in our cohort. Cases (dots) with larger primary tumor heterogeneity are above the diagonal, while those with a greater heterogeneity in the corresponding metastatic tumors are below the diagonal.
