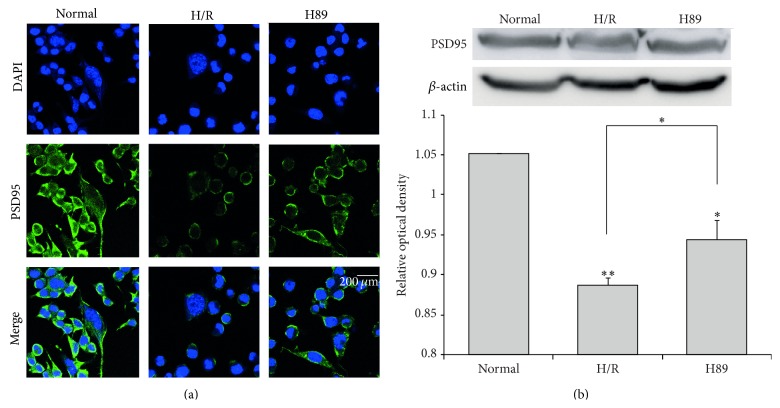
Figure 8.
The measurement of PSD-95 expression in Neuro2A cells after H/R-induced injury. The level of PSD-95 was evaluated by immunocytochemistry. This image shows that the expression of PSD-95 in the H/R group was decreased compared to the normal group. PKA inhibitor H89 pretreatment increased the expression of PSD-95 in spite of hypoxia reperfusion injury. (b) Western blotting experiments showed that the relative protein expression of PSD-95 slightly increased in the H89 group compared to the hypoxia reperfusion group. β-actin was used as an internal control. Data were expressed as mean ± S.E.M, and each experiment included 4 repeats per condition. Differences were considered significant at ∗ P < 0.05 and ∗∗ P < 0.001. Scale bar: 200 μm, PSD-95: green, 4′, 6-diamidino-2-phenylindole (DAPI): blue, normal: the normal control group, H/R: 4 hr hypoxia and 18 hr reperfusion injury group, and H89: 2 hr PKA inhibitor H89 treatment group before 4 hr hypoxia and 18 hr reperfusion injury.

