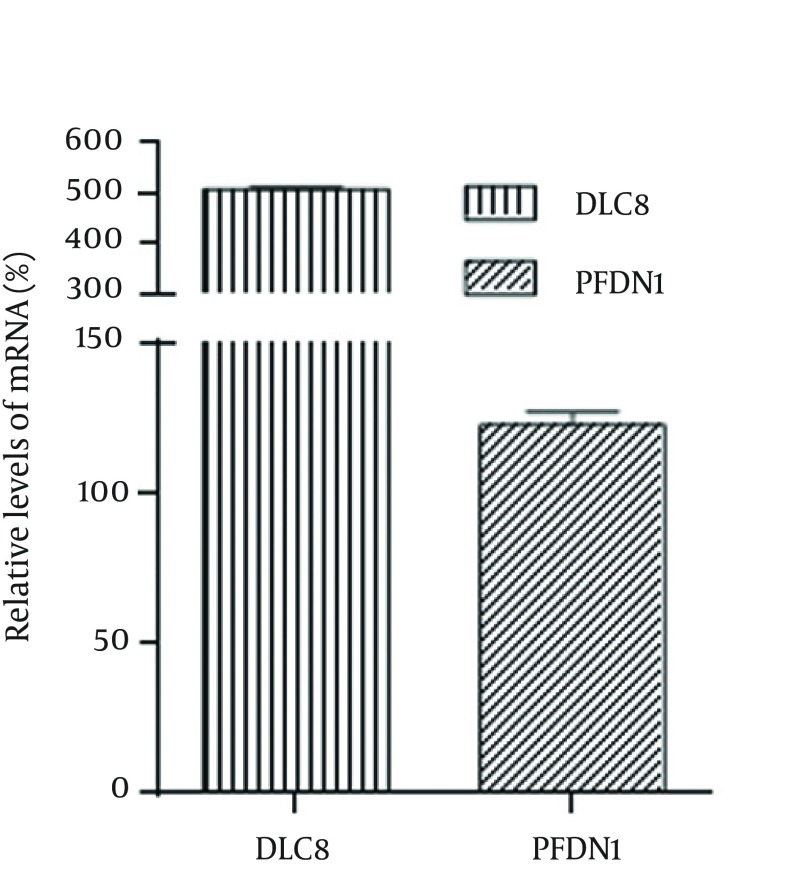
Figure 3. Analysis of Host Genes in Transcriptional Levels in the Rabies Virus-Infected Cells.
The transcripts of the genes were tested by comparative real-time qPCR, and GAPDH was used as internal control. The data are presented as a percent of the N2a cells mock infected in the parallel control set as 100%.

