Figure 5.

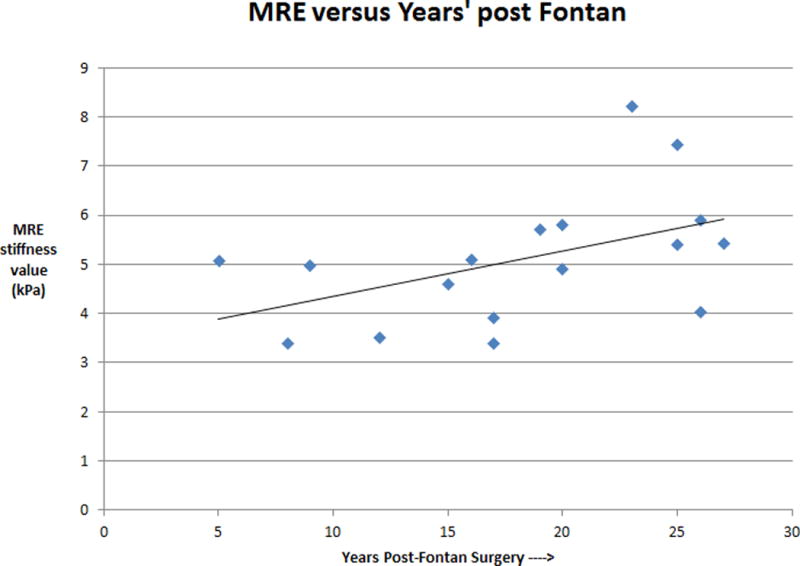
A graph of MRE liver stiffness versus years status post Fontan procedure (n=17). There is a trend towards increasing liver stiffness with increasing duration of Fontan physiology (correlation coefficient of 0.5 and p < 0.05).

A graph of MRE liver stiffness versus years status post Fontan procedure (n=17). There is a trend towards increasing liver stiffness with increasing duration of Fontan physiology (correlation coefficient of 0.5 and p < 0.05).