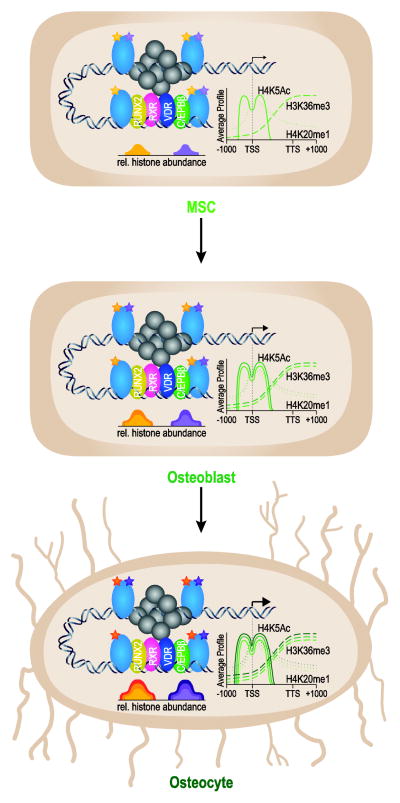
FIGURE 1.
Modulation of transcriptional output during the MSC to osteocyte transition is correlated with epigenetic abundance at enhancers and across the gene body. A model of gene up-regulation is shown schematically with associated changes in several representative histone (light blue) modifications (yellow and purple stars) and their quantitated abundance (bottom peaks) at osteoblast lineage enhancers marked by RUNX2 (yellow), RXR (pink), VDR (blue), and C/EBPβ (green). CEAS (Cis-regulatory element annotation system) analyzed histone modifications (right side) for H3K36me3 (dashed line), H4K20me1 (dotted line), and H4K5ac (solid line) across the gene body are also associated, and increased, with gene expression changes during this transition. The transcriptional start site is depicted by a black arrow (arrow size represents transcriptional output). (See references 15, 17 and 31).

