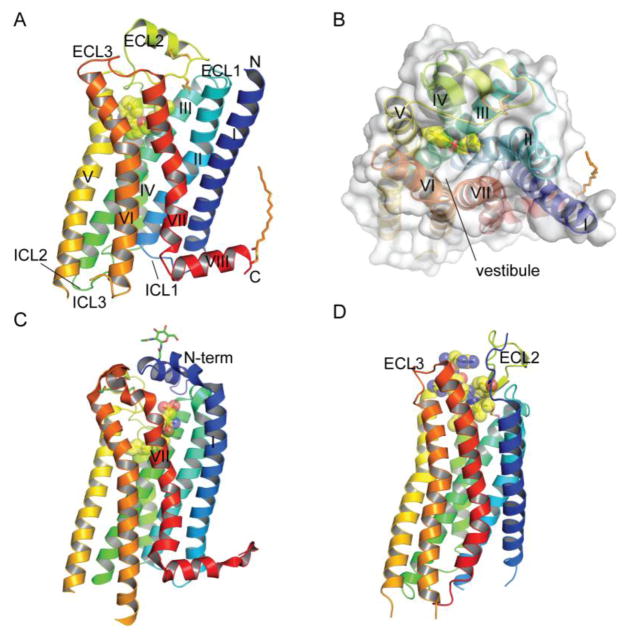
Fig. 1.
Structures of representative class A GPCRs and positions of orthosteric ligand binding pockets. (A) Structure of the β2-adrenergic receptor with a bound inverse agonist carazolol (PDB: 2RH1). (B) The β2-adrenergic receptor with bound carazolol viewed from the extracellular side. (C) Structure of the sphingosine-1-phosphate receptor with a bound antagonist lipid-mimic ML056 (PDB: 3V2Y). (D) Structure of the NTSR1 neurotensin receptor with a bound agonist peptide neurotensin8–13 (PDB: 4GRV). In all panels the receptor is color coded from N- to C-termini and the ligand is shown in stick representation and space-filling spheres. Extracellular (ECL) and intracellular (ICL) loops and the seven transmembrane helices are labeled. Disulfide bonds, palmitoylation at the C-terminus, and glycans at the N-terminus are also shown in stick representation. All figures were prepared with PyMol (Schrodinger).

