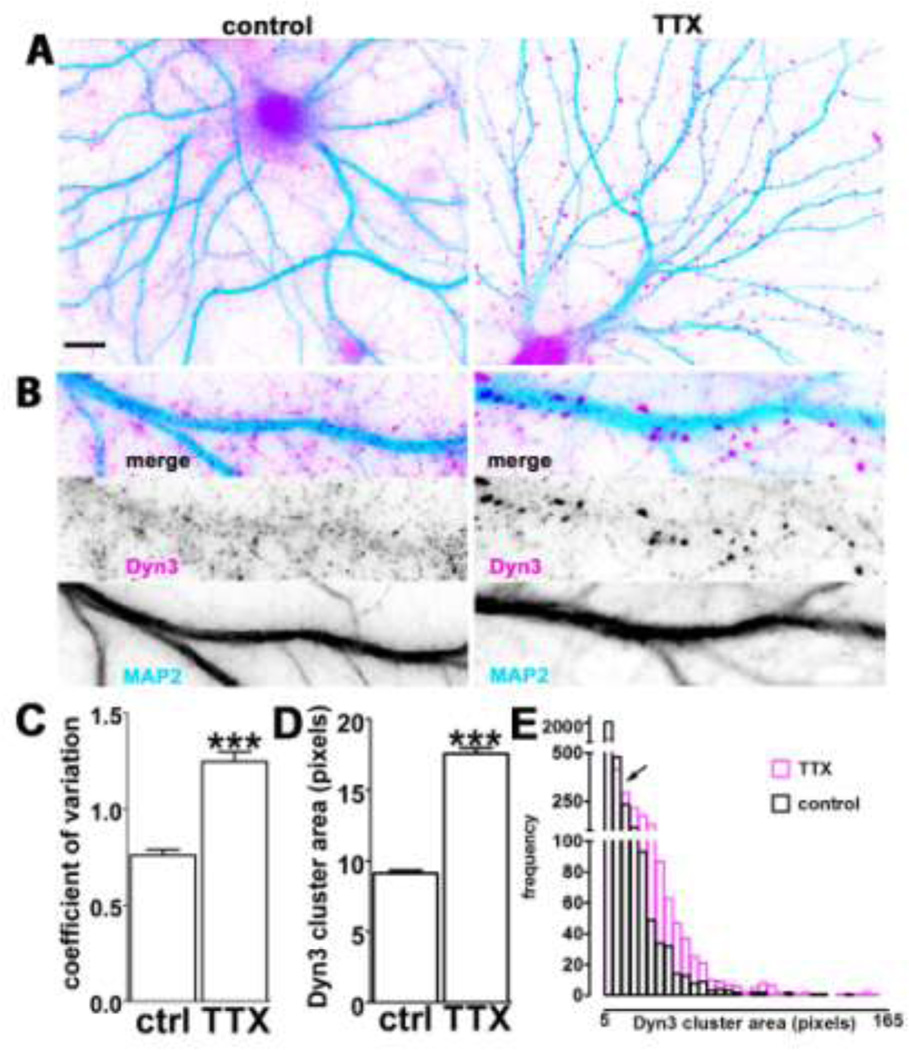
Fig. 2. Dyn3 clustering is accompanied by a decrease in small diffuse puncta.
A. Representative hippocampal neurons incubated in the absence (left) or presence (right) of TTX for 2 weeks, prior to double immunostaining for Dyn3 (magenta) and MAP2 (light blue) to highlight the dendritic arborization. Scale bar: 10 µM. B. Selected dendritic regions from 21 DIV hippocampal neurons, cultured with or without TTX and stained with anti-Dyn3 antibody (magenta) and anti-MAP2 (light blue). Image width: 35 µM. C. Comparison of the variability of pixel intensity for Dyn3, expressed as coefficient of variation of pixel intensity values (see the Experimental methods section for details) indicates that TTX (14 days) generates Dyn3 immunoreactivity that is less diffuse and more concentrated at particular locations (number of dendritic regions = 12 for each group, *** p<0.001; unpaired t-test). D. Quantification of Dyn3 cluster size after incubation with TTX (14 days). The data are expressed as mean ± SEM (*** p<0.001 unpaired t-test; number of clusters: control, 3150; TTX, 2329). E. Frequency histograms of Dyn3 cluster area in control (black) and after TTX (purple); bin size = 5 pixels. Black arrow indicates the part of the histogram where TTX shifts Dyn3 cluster size distribution from favoring clusters smaller than 10 pixels to those larger than 10 pixels.

