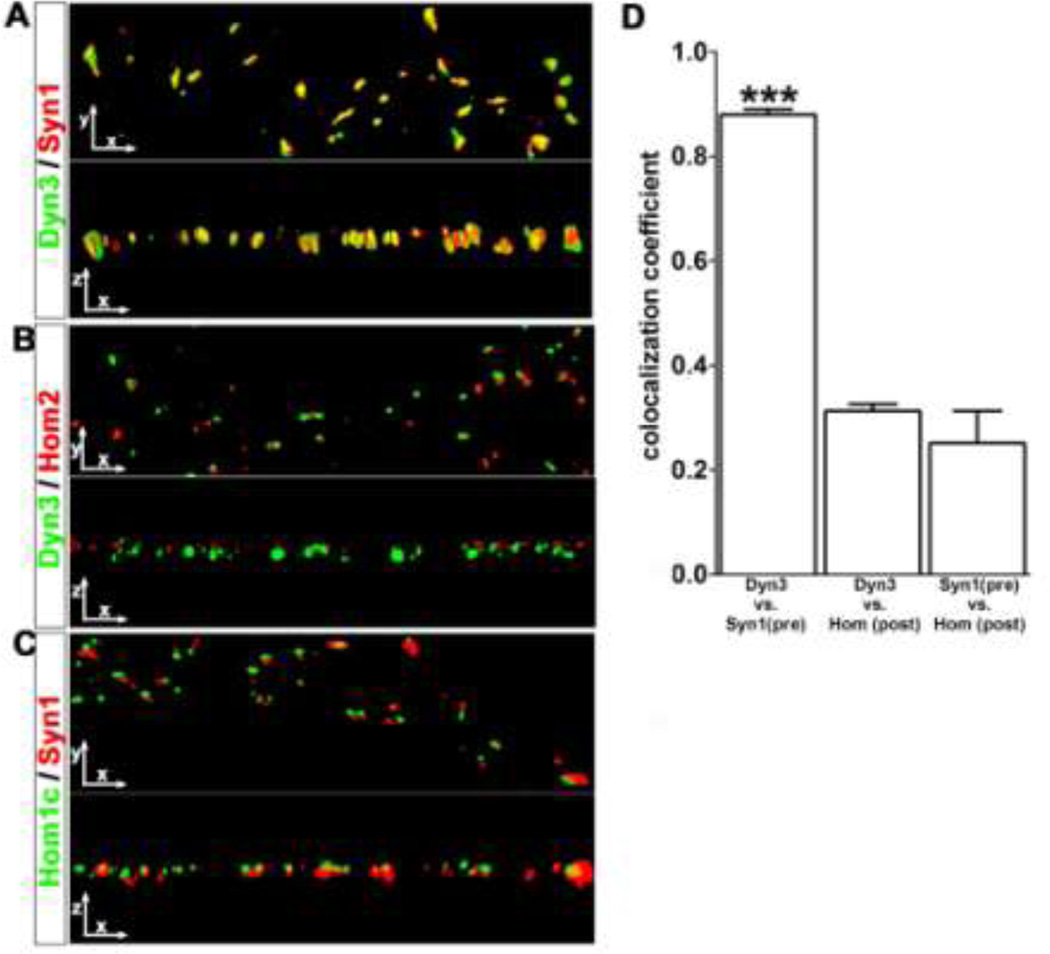
Fig. 3. TTX-induced Dyn3 clusters colocalize with pre-, not post-synaptic markers.
A–C. Three-dimensional surface renderings of dendritic regions, stained for Dyn3, Syn1, Homer 2 and Homer1c, as indicated, at 0 and 90 degree rotations after Z-series image collection and image deconvolution. In yellow regions of colocalization. Image width: 30 µM. D. The coefficient of colocalization between Dyn3 and Syn1 (0.87 ± 0.01, number of dendritic regions=15) was significantly higher than the coefficient of colocalization between Dyn3 and Homer (0.3124 ± 0.01, number of dendritic regions=8, p<0.001 one-way ANOVA, and Tukey’s multiple comparison post hoc test), or Syn1 and Homer (0.25 ± 0.06, number of dendritic regions =15, p<0.001 one-way ANOVA, Tukey’s multiple comparison test).

