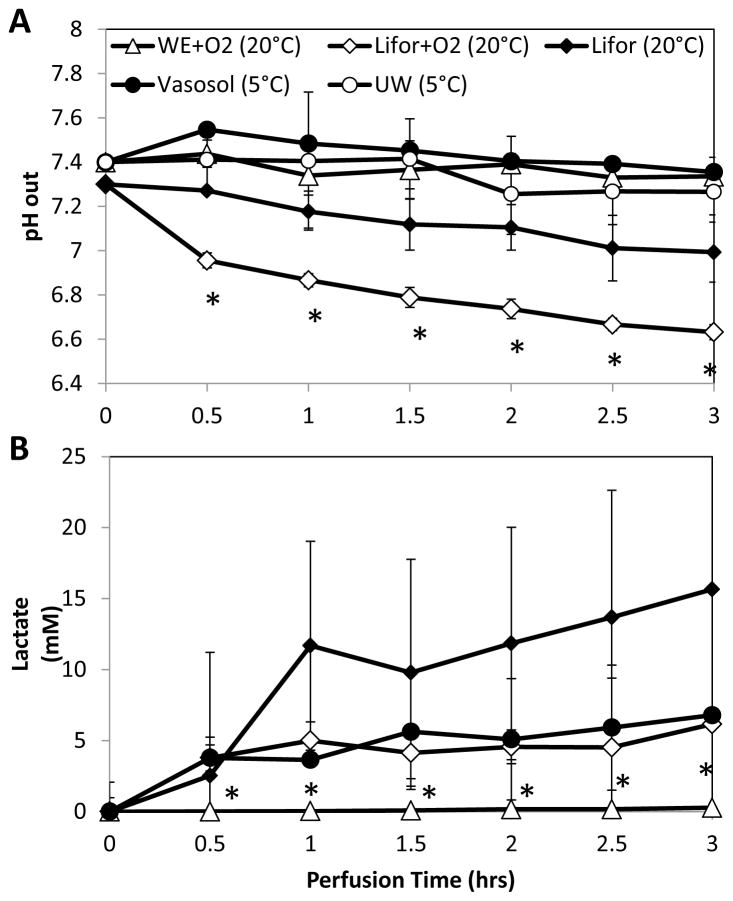
Figure 4.
pH and lactate trends during perfusion described perfusate pH buffering capabilities and the extent of aerobic metabolism. (A) Except for WE+O2 and UW, pH values tended to decline over the course of perfusion, but only Lifor-perfused livers exceeded physiological range (7.2–7.332). (B) Lactate values increased above physiological levels (1–1.2mM) in all groups except WE+O2. *Less than all other groups (p<0.05). Data are expressed as mean ± s.d.

