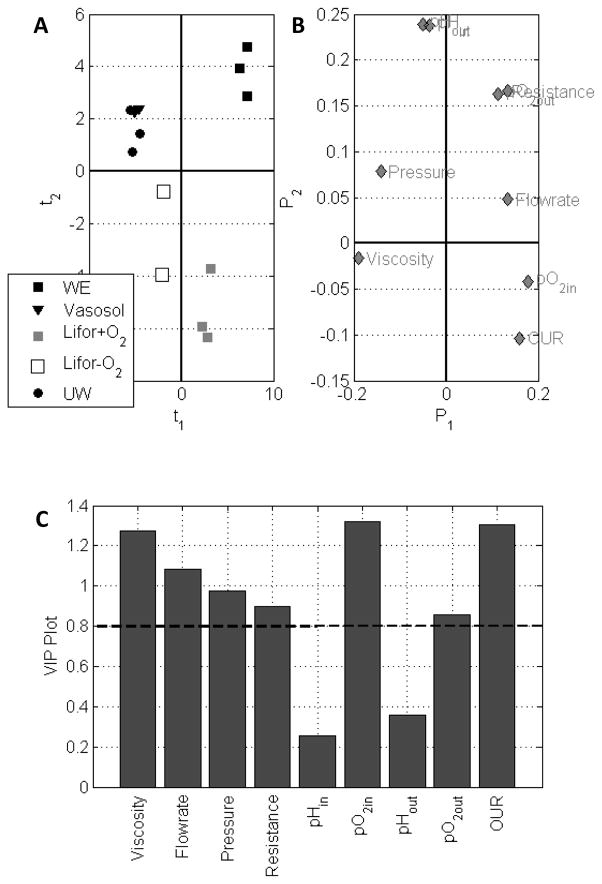
Figure 6.
MPLS models analyze the process variables with regards to the perfusates used. (A) Score biplots cluster groups illustrating similarities between UW and Vasosol based on viscosity, but differences between Lifor and Lifor+O2 based on oxygenation. (B) The loading plot and (C) VIP plot with a cutoff of 0.8 illustrates that viscosity, pressure, resistance and oxygen delivery rates have a major influence on the model response.

