Fig. 3.
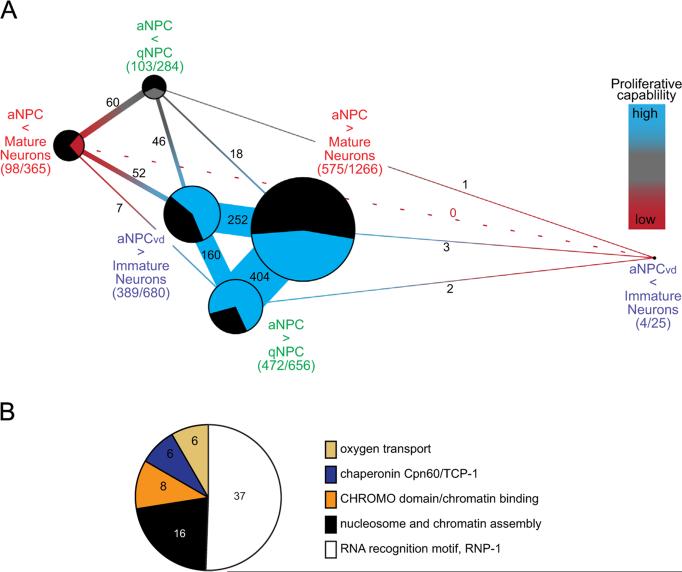
aNPCs share networks of differentially expressed transcripts. (A) Networks of differentially-expressed transcripts that are shared between NPCs. Transcripts with positive expression values (more highly expressed in NPCs) or negative expression values (more highly expressed in neurons or quiescent NPCs) were analyzed separately. Each node of the network indicates the groups of positively (blue) or negatively (red)-expressed genes for each microarray comparison, nodes separated by short distances and thicker connections indicate that the groups share many transcripts. The size of the pie diagram at each node represents the total number of differentially expressed genes and the number of unique genes unshared (black) and shared between groups (blue, gray or red). Blue represents genes enriched in aNPCs with high proliferative capability, gray represents enrichment in qNPCs and red indicates enrichment in neurons with the lowest proliferative capability. Numbers on the connecting segments are the numbers of transcripts in common between the groups. (B) DAVID Functional Annotation Clustering tool identified 5 gene families that are enriched in multiple aNPC datasets: nucleosome and chromatin assembly genes, RNA recognition motif RNP-1 family, CHROMO domain containing chromatin binding genes, the TCP-1 chaperonin family and genes associated with oxygen transport.

