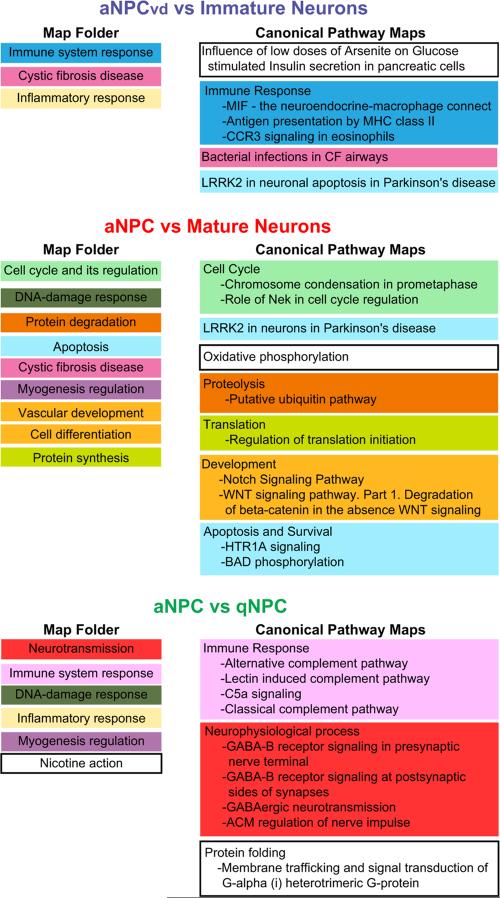
Fig. 4.
MetaCore analysis of differentially expressed transcripts in NPCs and Neurons. Map Folders (left column), which identify broad functional categories, and Canonical Pathways Maps (right column), which identify more specific candidate interaction pathways, are listed in the order of significance, from top to bottom of the lists. Pathway Maps that are within Map Folders are color coded. The top 10 significant pathways from MetaCore (p<0.05 and False Discovery Rate <0.05) are presented here. Specific components of the Pathway Maps that were identified in the microarray comparisons are shown in Supplementary Table 3.

