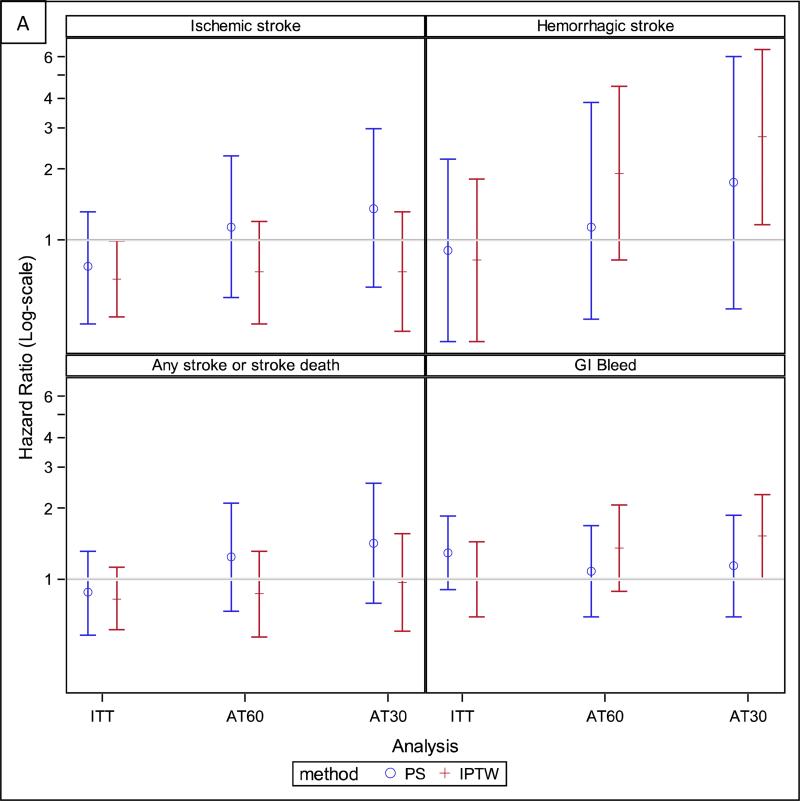
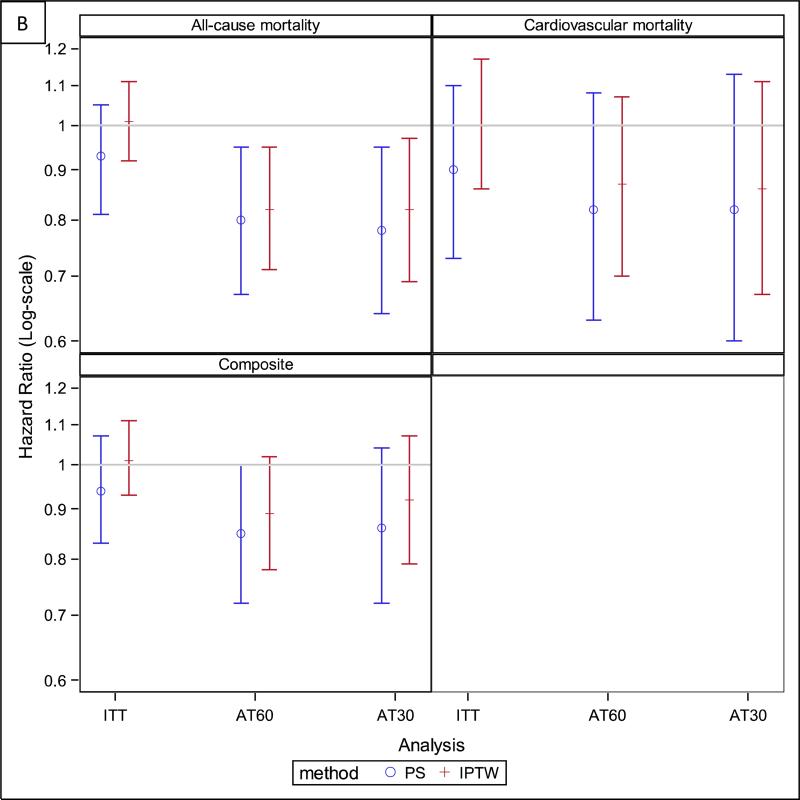
Figure 3.
Hazard ratios for all study outcomes for both the primary analyses [based on the full inverse probability of treatment and censoring-weighted (IPTW) cohort] and the sensitivity analyses [based on the propensity score (PS) matched cohort]. Panel A: Stroke and bleeding outcomes. Panel B: Mortality and composite outcome. AT60 – as treated analysis where patients were censored 60 days after their drug supply ran out, AT30 – as treated analysis where patients were censored 30 days after their drug supply ran out, ITT – intention to treat.


