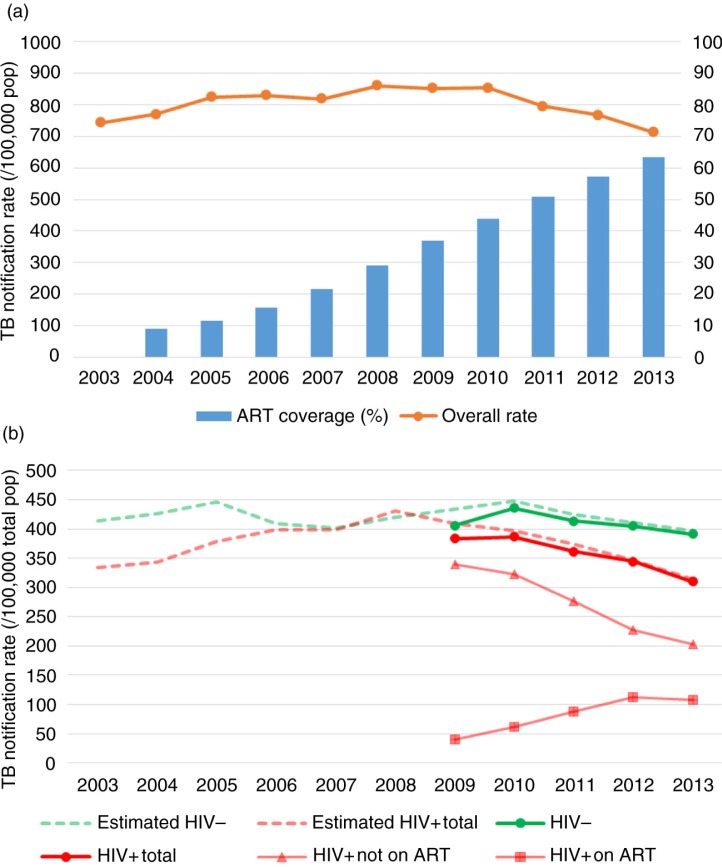
Figure 1.
(a) Overall TB notification rates and ART coverage in the estimated HIV-positive population over time. (b) TB notification rates per total population over time, overall, and stratified by HIV status and by ART use at start of TB treatment. The number of HIV-positive and HIV-negative TB notifications pre 2009 were estimated using the proportion of HIV positivity among the TB notifications with a known HIV status.
Note: HIV−, HIV negative; HIV+, HIV positive.

