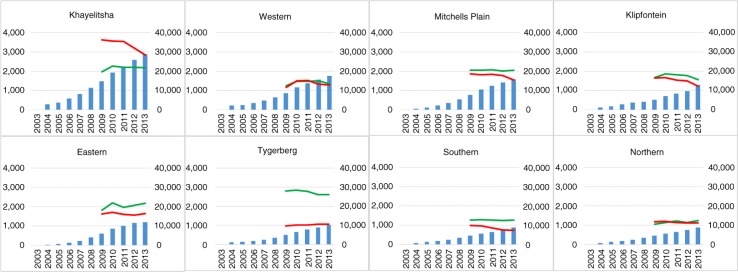
Figure 3.
Absolute number of TB notifications per health sub-district over time. Left vertical axis: HIV-negative (green) and HIV-positive (red) TB notifications. The blue bars represent absolute numbers of people on ART (right vertical axis). The health sub-districts are ordered by the total number of people on ART in 2013.

