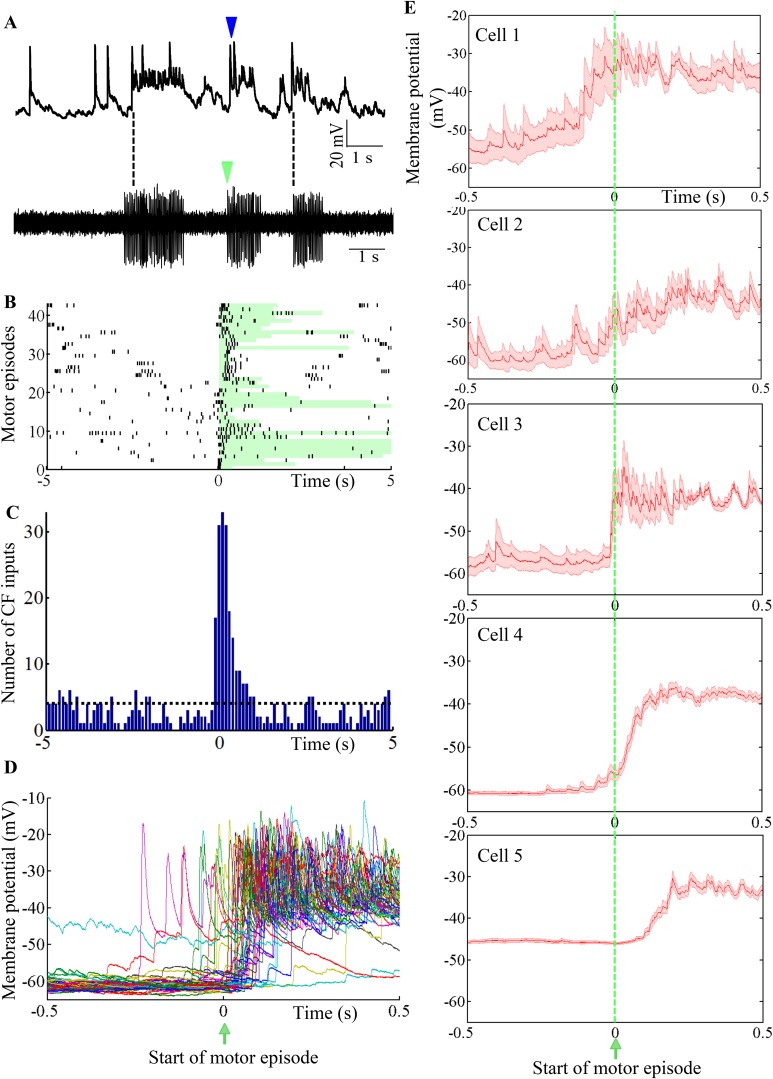
Figure 8. Purkinje neuron bursts are timed to occur with motor neuron bursts.
(A) Representative trace showing intracellular recording from a Purkinje neuron (top trace) and suction electrode recording from axial myotomes (bottom trace). Purkinje neuron bursts (blue arrowhead) occur together with initiation of motor episodes (green arrowheads). (B) Raster plot of CF inputs (black bars) in a 10 s window around the start of motor episodes (0 on x-axis). The duration of each motor episode is shown as a pale green bar. The plot shows data from 43 motor episodes arranged on the y-axis. CF-EPSPs from 5 Purkinje neurons were plotted. (C) Peri-event time histogram showing CF inputs clustered at the beginning of the motor episode (0 on x-axis). For every motor episode, the number of CF inputs within a 10 s window was calculated in bins of 100 ms. This was repeated for five cells and the results pooled. The dashed line indicates the average CF number per bin. (D) Voltage traces from a Purkinje neuron in a 1 s window around the start of motor episodes (0 on x-axis). 38 traces have been aligned and overlaid by placing the respective motor episode initiation at 0 s. (E) Same plot as in D for each of 5 Purkinje neurons. However, average membrane potential (red line) and standard error of mean (pink shaded region) are shown instead. Cell 4 is the same as the one shown in D.

