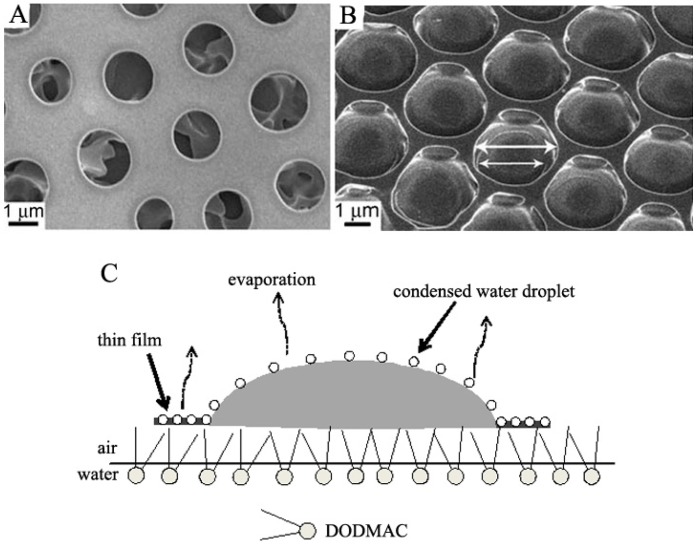
Figure 13.
SEM images of the honeycomb structures formed at the gold nanoparticle concentration of 0.8 g/L (A) and 0.6 g/L (B); (C) Schematic diagram of the honeycomb film formation mechanism at air/water interface. The copyright permission was from [99].

