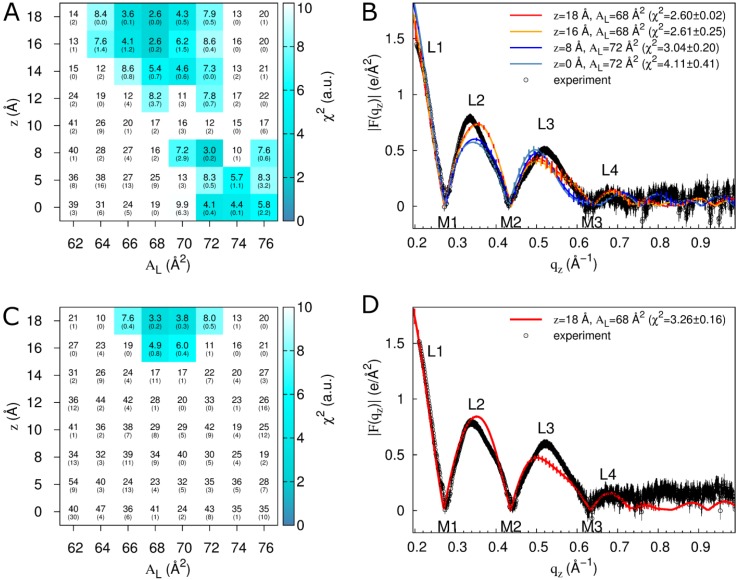
Figure 3.
Fits of simulation to experiment for a systematic evaluation of z and AL in DOPC:DOPE (1:1). Data are from simulations with two (A,B) or four (C,D) molecules of Tat47–57 (simulation mole fractions of 0.015 and 0.030, respectively; comparisons are to experimental data at mole fractions of 0.016 and 0.034, respectively). (A,C) Color and inset numbers represent χ2 values (standard deviations of averages from repeat simulations in parentheses). (B,D) Selected form factors (χ2 values in parentheses). Out-of-plane scattering lobes (L) and minima (M) are numbered based on experimental data, which are averaged over two (B) and nine (D) experiments. Black vertical lines depict experimental error estimates (see Methods). Vertical lines on the simulation data depict standard deviations between two starting configurations. Experimental data in (B) and (D) were scaled to the simulations at z = 18 Å, AL = 68 Å2 (see Methods).

