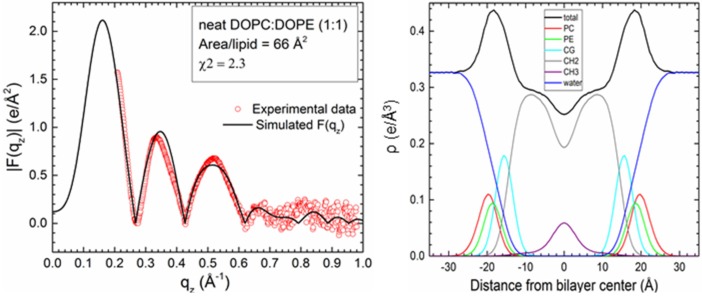
Figure 4.
Detailed comparison of |F(qz)| (left) between neat DOPC:DOPE (1:1) experimental data points (open red circles) and simulation |F(qz)| (black line) at the AL that yielded the smallest χ2 (AL = 66 Å2, χ2 = 2.3). Experimental data were scaled to the simulated |F(qz)|. Electron density profile (right) from the same simulation with component groups indicated in the figure legend. PC, phosphatidylcholine and PE, phosphatidylethanolamine headgroups; CG, carbonyl-glycerol; CH2, methylenes and methines in hydrocarbon chains; CH3, terminal methyl group.

