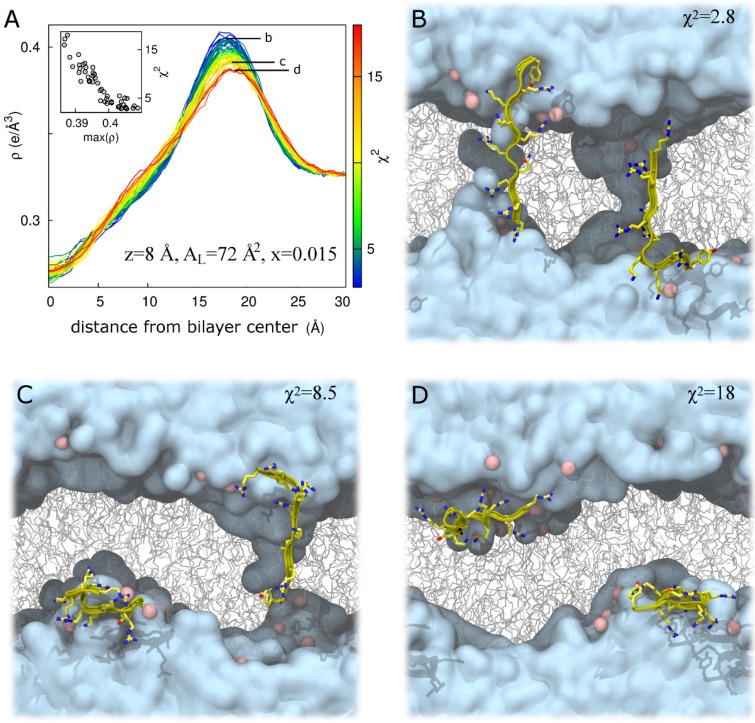
Figure 7.
Bilayer undulations increase χ2 in DOPC:DOPE (1:1) at z = 8 Å, AL = 72 Å2 for a Tat47–57 mole fraction of 0.015. (A) Total system electron density, ρ, as a function of absolute distance from the global bilayer center along its global normal for N = 52 simulations, colored by χ2 value representing a range from best (blue) to worst (red) fit to experiment. Inset, χ2 as a function of the maximum value of ρ. Labels b, c, and d in part A identify electron density curves for systems whose snapshots are shown in parts B, C, and D, respectively. (B–D) Snapshots after 100 ns of simulation in repeats with χ2 values of 2.8 (B); 8.5 (C); and 18 (D). Water is cyan, lipids are gray, lipid headgroup phosphorus atoms are pink, and protein is yellow. Protein is rendered in front of all other molecules for clarity.

