Figure 8.
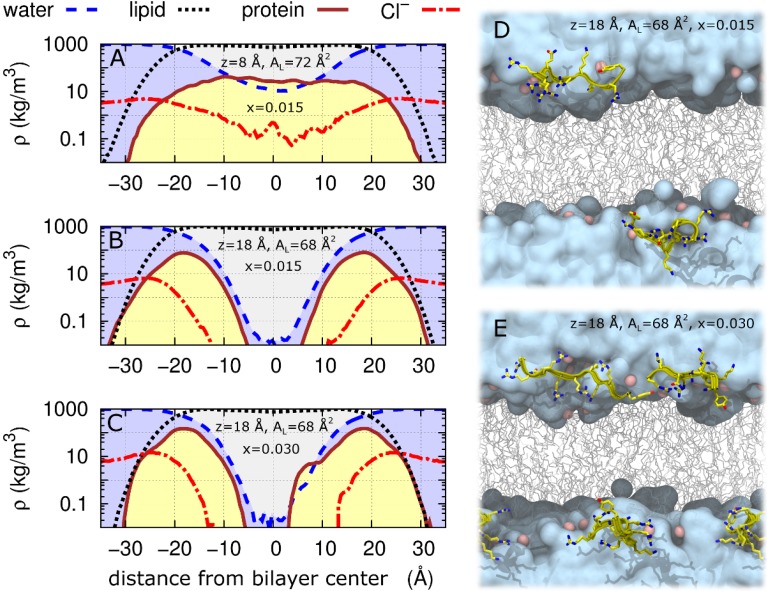
Log scale of mass densities along the DOPC:DOPE (1:1) bilayer normal and snapshots of peptide insertion into the bilayer headgroup region. (A–C) Average mass density, ρ, of water (dashed blue line), lipid (dotted black line), protein (solid brown line), and Cl− (dash-dot red line) as a function of distance from bilayer center (Å). Simulations restricted to χ2 < 3.4 are shown: (A) averages of the 10 (of N = 52) simulations at z = 8 Å, AL = 72 Å2 and a Tat47–57 mole fraction of 0.015; (B) all N = 52 simulations at z = 18 Å, AL = 68 Å2 and a Tat47–57 mole fraction of 0.015; and (C) both N = 2 simulations at z = 18 Å, AL = 68 Å2 and a Tat47–57 mole fraction of 0.030. Snapshots after 100 ns of simulation at z = 18 Å, AL = 68 Å2 and a Tat47–57 mole fraction of (D) 0.015 or (E) 0.030. Water is cyan, lipids are gray, lipid headgroup phosphorus atoms are pink, and protein is yellow. Protein is rendered in front of all other molecules for clarity.

