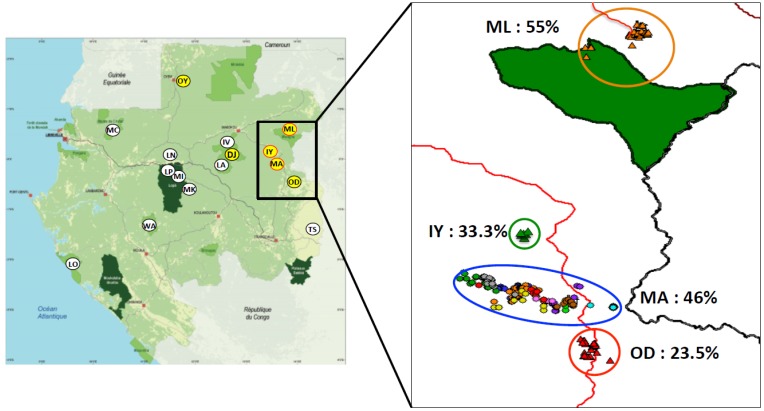
Figure 3.
SIVcpz antibody positive samples from north-east Gabon. A/ Yellow circles with red perimeter represent sampling sites where SIVcpz have been PCR amplified. B/ details of SIVcpz positive sampling sites: colored circles correspond to the color codes used to represent the different SIVcpz identified in Figure 4 and Figure 5: Blue = MA, Green = IY and Orange = ML. Triangles correspond to SIVcpz antibody positive faecal samples collected in OD, IY and ML. Dots correspond to SIVcpz antibody positive faecal samples collected in MA. Prevalence based on serological tests is showed for each site. The trail linking Odjala to Malouma is represented by a red line. The green area corresponds to the different national parks. The site of DJ is not represented.

