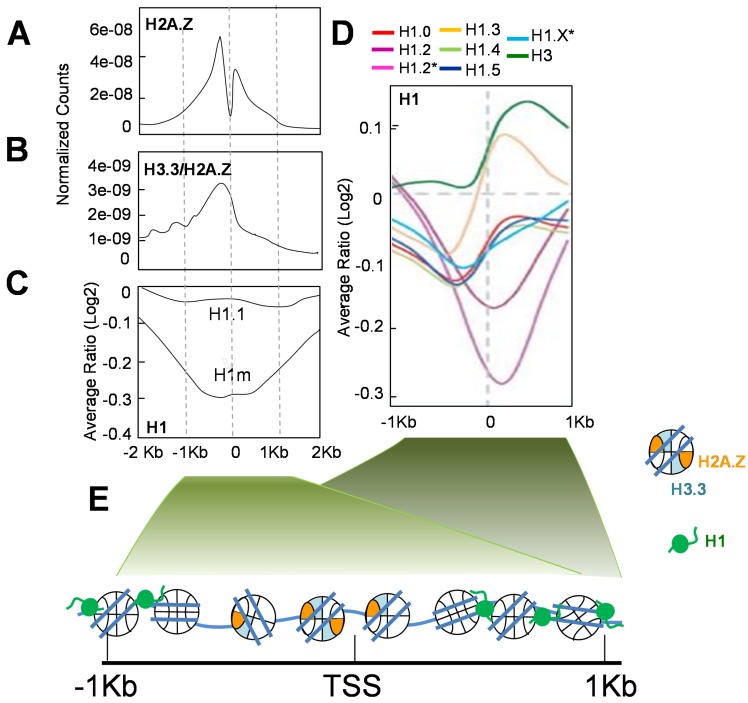
Figure 7.
Histone occupancy profiles around TSS. (A) Averaged H3.3/H2A.Z nucleosome positioning [70]; (B) Profile of histone H2A.Z distribution in high and medium transcriptionally active genes [167]; (C) Histone H1 subtypes distribution at TSS for transcribed and non-transcribed genes. H1.1 corresponds to the distribution observed for this subtype as compared to H1m, corresponding to the average for H1.2-H1.3-H1.4-H1.5 [162]; (D) Depletion of histone H1-tagged subtypes at promoters. The asterisks indicate analysis conducted using the endogenous histones [163]; (E). Schematic representation of histone variants H3.3 and H2A.Z, and histone H1 distribution around gene promoters.

