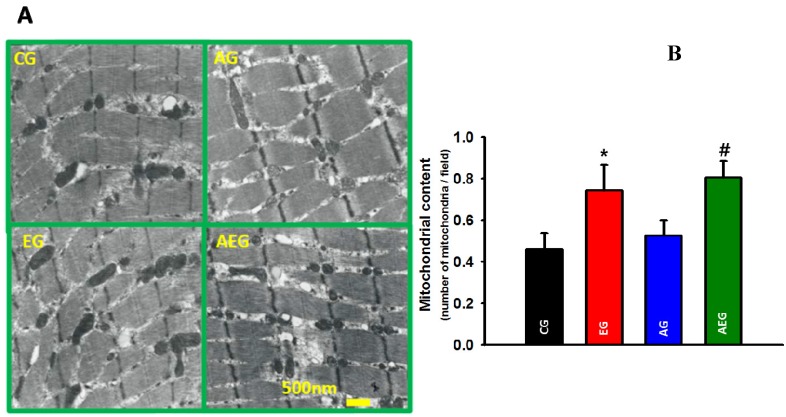
Figure 3.
(A) Difference in skeletal muscle mitochondria based on transmission electron micrograph imaging between the groups. (B) Mitochondrial content was expressed as content of mitochondria/field. Control group (CG), Echi A-treated group (EG), aerobic exercise group (AG), and aerobic exercise group treated with Echi A (AEG). * p < 0.05; CG vs. EG, # p < 0.05; CG vs. AEG. The data are expressed as means ± SE.

