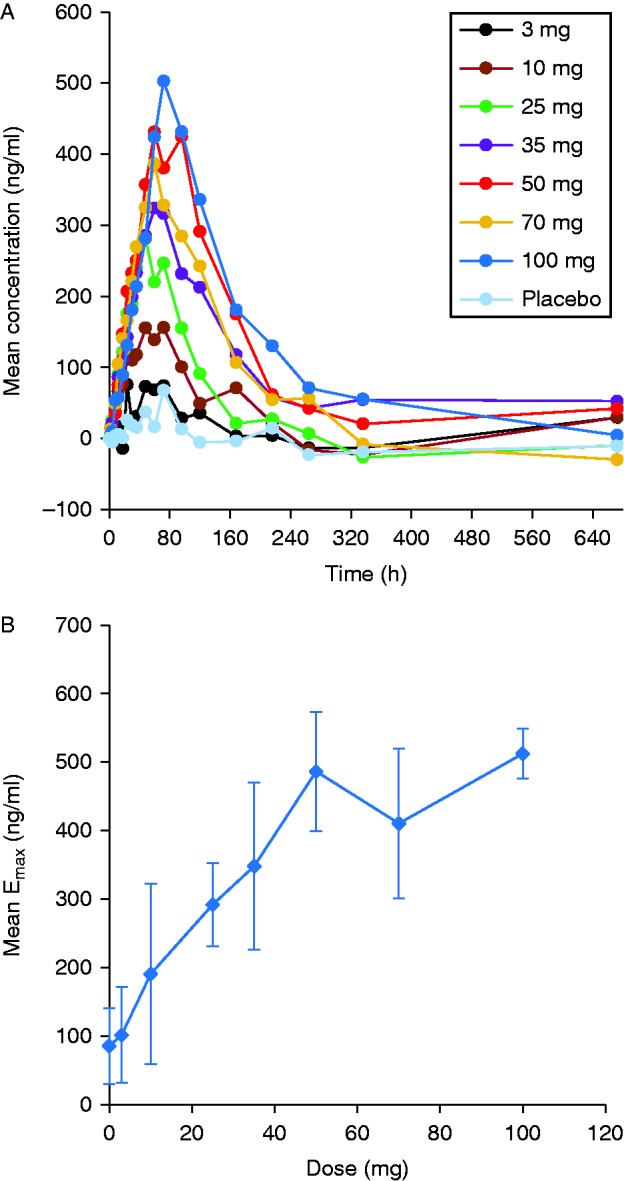
Figure 3.

(A) Mean serum concentrations of IGF1. (B) Mean IGF1 maximum observed response (Emax) in relation to TV-1106 dose. IGF1 concentrations in panels A and B were adjusted for each subject by subtracting the baseline concentration calculated from a mean of pre-dose concentrations.

 This work is licensed under a