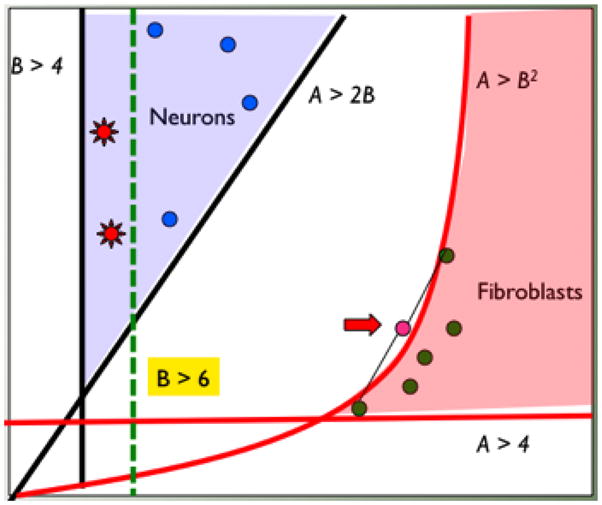
Figure 2.

A schematic diagram representing our conceptual model for the relationship between transcriptome and phenotype. Cells of a given external phenotype (e.g., neurons and fibroblasts; blue dots and green dots) are seen to map to broad domains of molecular state space (many-to-one relationship). The domains are determined by stoichiometric constraints of active pathways (schematically represented as inequalities). Some constraints may be nonlinear due to multi-component interactions (A>B2). Non-linear constraints may lead to population averages of cells being outside the state of any cell (red arrow). The constraints may change (e.g., from B>4 to B>6) due to physiological changes (e.g., aging) or external stimuli (e.g., chemotherapy drug) and the response of the cells may be heterogeneous due to original variation (red stars within blue dots representing neurons) explaining phenomena such as drug resistance or heterogeneous degeneration.
