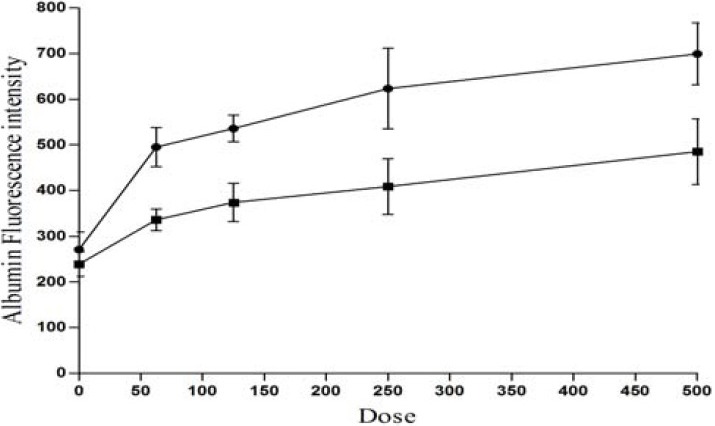
Fig. 2.

Dose response curve of PGE2 with respect to the fluorescence intensities. Animals were injected with 1 ml fluorescein labeled albumin (100 μg albumin/ml), via their internal right jugular vein and PGE2 at dose ranges from 0 to 500 μg were infused into the rat right brain hemisphere (see Method section), and the fluorescence intensities were measured 16 h after infusion at right (-●-) and left (-■-) brain supenatant.
