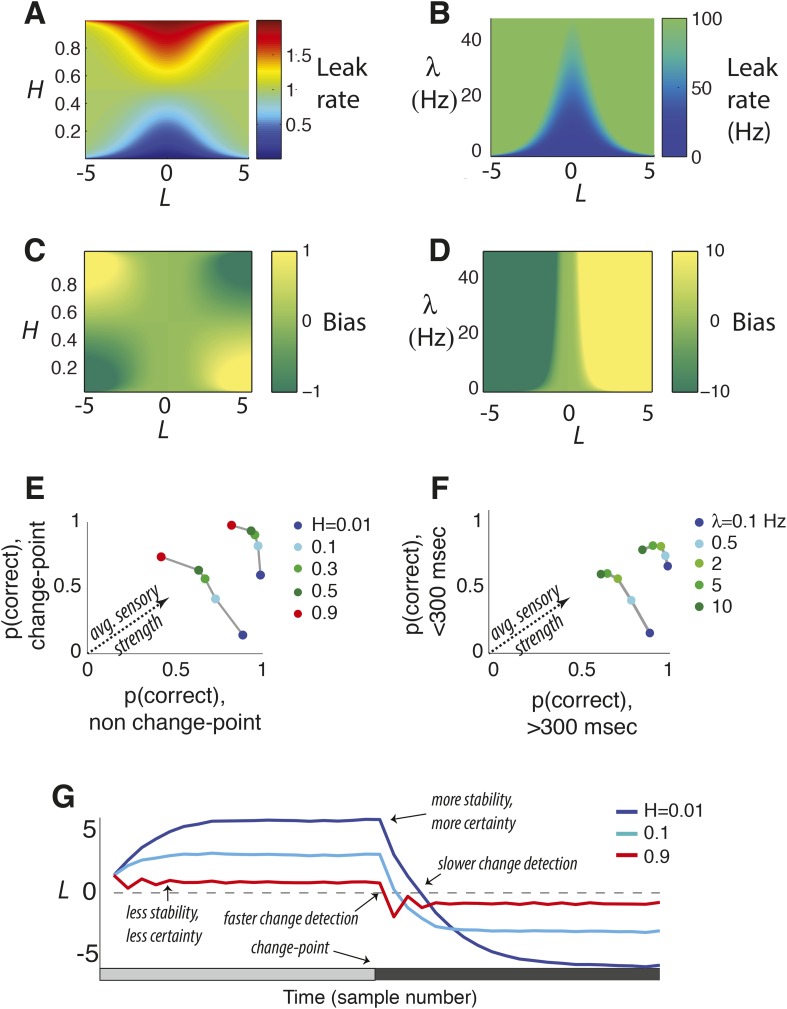
Figure 2. Features of the discrete-time (A, C, E, G) and continuous-time (B, D, F) normative models.
(A, B) Leak rate as a function belief state and hazard rate. Blues are the least leaky and correspond to longer temporal accumulation; reds are the most leaky and correspond to a sign reversal in the change in current belief, resulting in damped oscillations in choice behavior. For the continuous-time model (B), there are no leak rates analogous to discrete-time H > 0.5. (C, D) Bias as a function belief state and hazard rate. Dark greens are the most biased in favor of the alternative associated with negative log-odds; yellows are the most biased in favor of the other alternative. (E, F) Predicted choice accuracy one sample (E) or <300 ms (F) after a change-point vs during steady-state conditions, at different expected hazard rates, as shown, for two difference strengths of evidence (E: |LLR| = 0.5 for leftmost curves and 5 for rightmost; F: |LLR| = 4/s for leftmost curves and 80/s for rightmost). (G) Average belief from the discrete-time model over 1000 simulations for each condition shown, each with a single change-point at trial 20.

