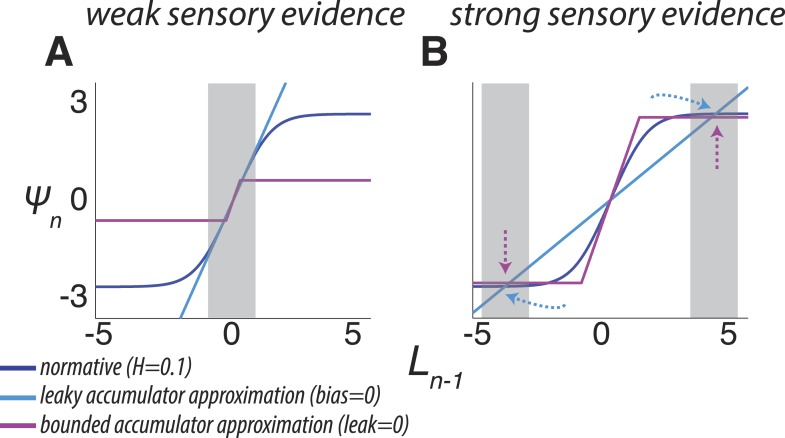
Figure 3. Two ways of approximating the discrete-time normative model, accounting separately for its dynamics when the sensory evidence is consistently weak (A, average |LLR| ≈ 0.25) or strong (B, average |LLR| ≈ 10).
As in Figure 1B, each panel has discrete-time log-prior odds as a function of the belief at the previous moment. Dark blue lines correspond to the normative model for H = 0.1. Light blue lines correspond to a leaky accumulator with no bias, related to the linear approximation in Equation 3a but optimized to best approximate the normative model separately for each average evidence strength in A and B. Magenta lines correspond to perfect accumulation (no leak) to a stabilizing boundary related to Equation 3b,c, also optimized for each evidence strength. In general, the leaky accumulator is better at approximating the normative solution for weak sensory evidence (A), whereas the bounded accumulator is better at approximating the solution for strong sensory evidence (B).

