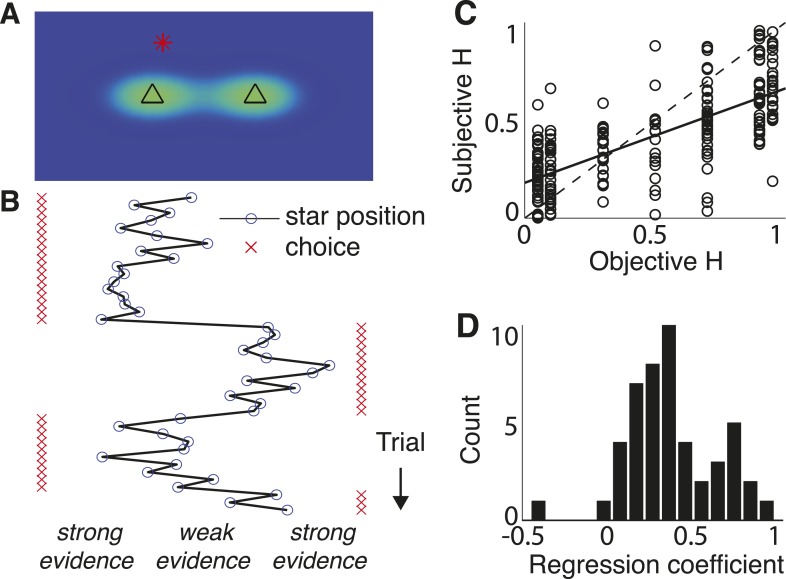
Figure 4. Triangles task and normative model fits.
(A) Example task screen. Triangles and surrounding greenish clouds represent the means and variances of the two generative processes; red star is a single sample (in this case generated by the left process). (B) Sample trials, with actual star position indicated by blue circles and subject choices indicated by red ‘x’. Star positions close to the center represent weak evidence for either of the alternatives because the respective probabilities of either source generating the star position are close. Star positions towards the edge of the screen represent strong evidence for the triangle to which the star is closest. (C) Block-wise subjective (fit) H vs objective H. Dotted line is unity; solid line is a least-squares fit. (D) Histogram of slope coefficients from least-squares fits as in C, calculated for individual subjects.


