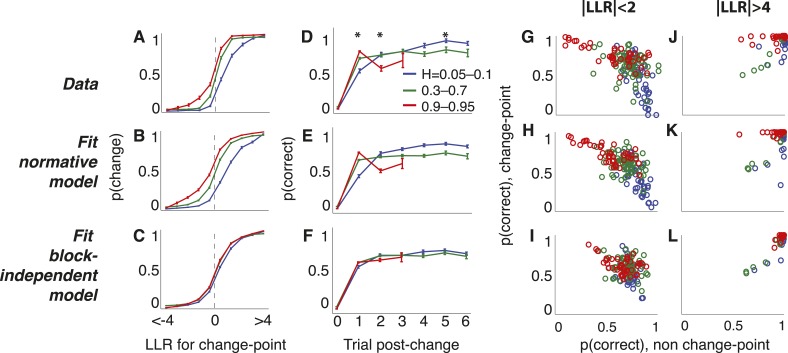
Figure 5. Triangles task choice data pooled across all 48 subjects (top row), plus predictions from fits to the normative model allowing a different subjective hazard rate to be assigned to each block (middle row) and from fits to a model with subjective hazard rates randomly assigned across trials (bottom row).
Colors are different ranges of objective H, as shown in panel D. Errorbars are bootstrapped sem. (A–C) Probability of switching choices as a function of the LLR for a change in the correct answer. Data were restricted to trials following strong evidence (|LLR| > 4) to directly investigate the ‘strong belief’ regime of the model predictions. (D–F) Probability of switching sides in which a strong LLR (|LLR| > 4) for the original side was followed by a change-point and weak (|LLR| < 2) evidence for the opposite side. Significant differences by H in subject data are indicated by asterisks (Bonferroni corrected p < 0.05, χ2 test). (G–L) Block-by-block choice accuracy on change-point vs non-change-point trials when the evidence (magnitude of LLR, as indicated) was relatively weak (G–I) or strong (J–L). Points are individual blocks that included ≥5 trials with the indicated conditions.

