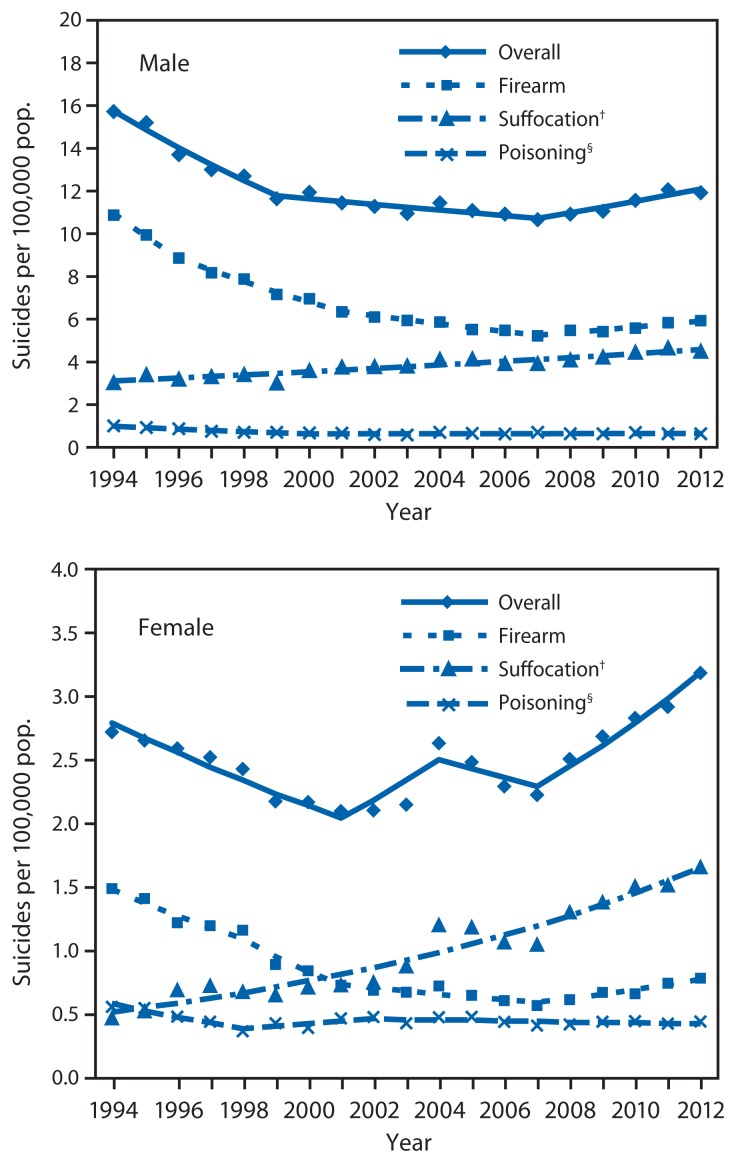
FIGURE.
Age-adjusted suicide rates among persons aged 10–24 years, by sex and mechanism — United States, 1994–2012*
* Symbols (diamond, square, triangle, x) representing joinpoints are displayed on the line graphs because, for both males and females, some of the suicide rates were best fitted by multiple segments of lines (number of joinpoints >0).
† Including hanging.
§ Including drug overdose.

