Figure 4.
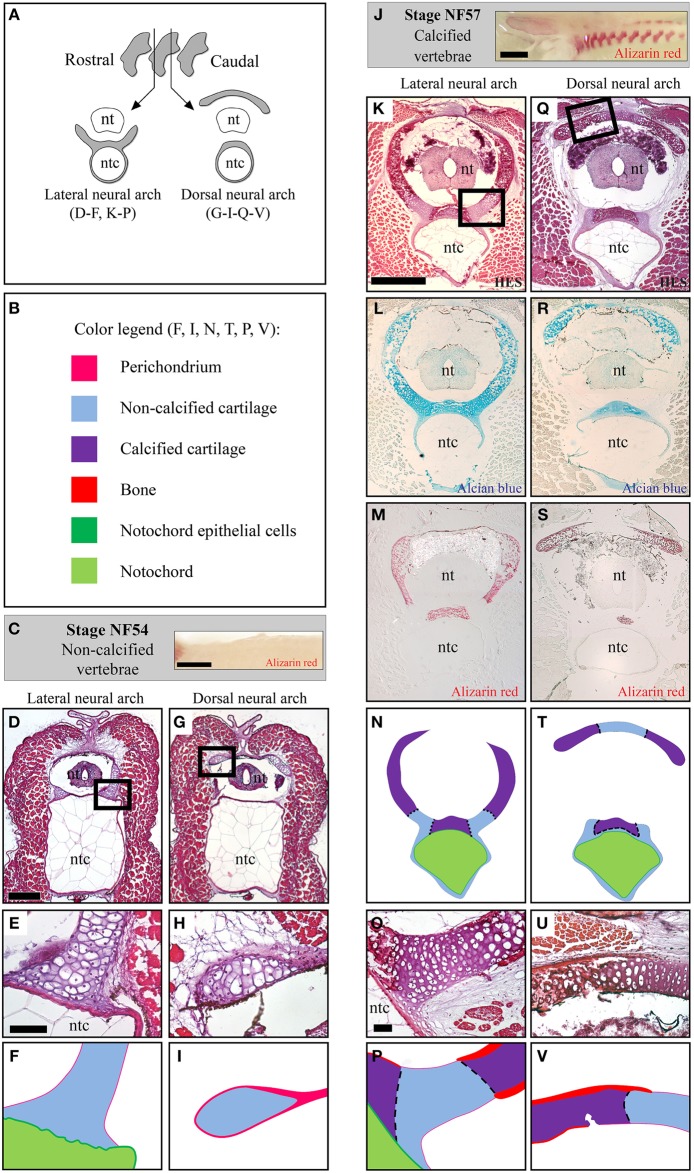
Histology of the developing Xenopus tropicalis vertebrae. (A) Schematic drawing of transverse sections running through the lateral or the dorsal region of the neural arches. (B) Color code used to represent the distinct skeletal tissues of the X.t. vertebrae in (F,I,N,T,P,V). (C) Whole mount Alizarin red staining of stage NF54 vertebral column (lateral view, anterior to the left). (D–I) Histology of the stage NF54 vertebrae examined with HES (D,E,G,H). (J) Whole mount Alizarin red staining of stage NF57 vertebral columns (lateral view, anterior to the left). (K–V) Histology of the stage NF57 vertebrae examined with HES (K,O,Q,U), Alcian blue (L,R) and Alizarin red (M,S). Insets in D, G, K and Q are shown in F, I, P and V, respectively. Panels E, H, K, O, Q and U are schematized in F, I, N, P, T and V, respectively. Abbreviations: nt, neural tube; ntc, notochord. Scale bars: 1 mm in (C,J); 250 μm in (D,G); 50 μm in (E,F) and (H,I); 500 μm in (K–N) and (Q–T); and 50 μm in (O,P,U,V).

