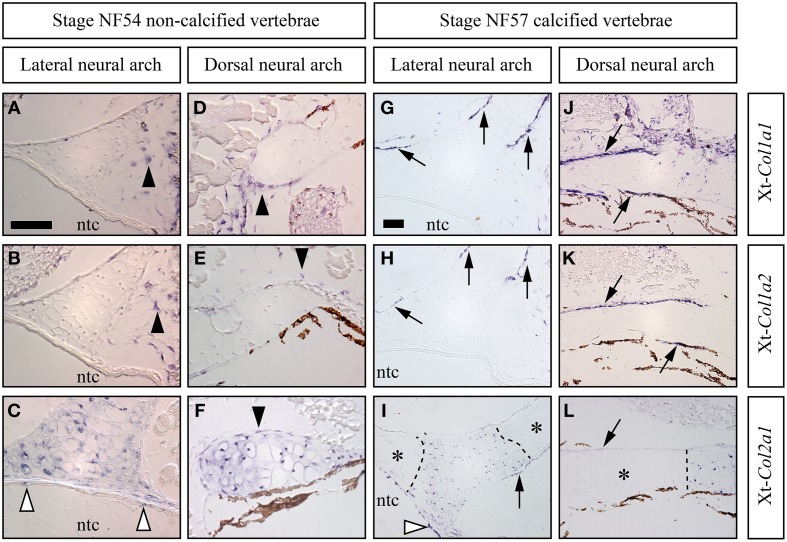
Figure 5.
Skeletal expression patterns the Xt-Col1a1, Xt-Col1a2, and Xt-Col2a1 during Xenopus tropicalis vertebrae development. Transverse sections of stage NF54 (A–F) and NF57 (G–L) vertebrae processed for in situ hybridizations using the Xt-Col1a1, Xt-Col1a2, and Xt-Col2a1 probes, as indicated. Black arrowheads show loose (A,B) or perichondral (D–F) cells. White arrowheads in (C,I) show Xt-Col2a1 positive epithelial non-vacuolated cells of the notochord. Arrows point at osteoblasts expressing Xt-Col1a1 (G,J), Xt-Col1a2 (H,K), or Xt-Col2a1 (I,L). In (I,L), calcified, Alizarin red-positive cartilaginous regions are marked by an asterisk and the dotted lines demarcates expression boundaries between Xt-Col2a1 positive and Xt-Col2a1negative chondrocytes. In situ hybridization signal is light to dark blue. Brown endogenous X.t. pigment cells are also visible in the vicinity of the dorsal neural arch (D–F, J–L). Scale bar in (A) represents 50 μm in (A–F); scale bar in (G) represents 50 μm in (G–L).

