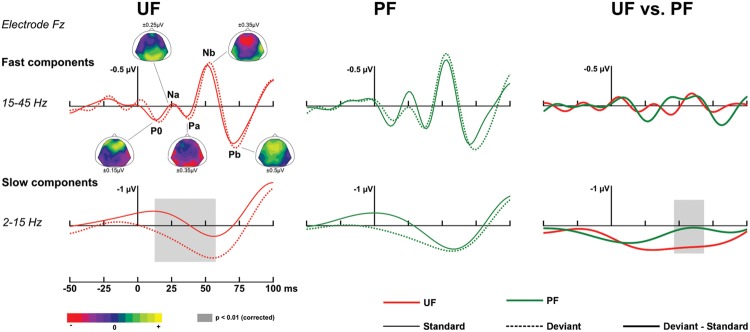
FIGURE 3.

Early responses. Traces at electrode Fz in the time interval [-50, 100] ms, with original [-200, 0] ms baseline correction. Fast components, bandwidth 15–45 Hz (top row). Grand-average ERPs elicited by standards just preceding a deviant (solid line) and deviants (dotted line) for condition UF (left column) and PF (middle column). Data were re-referenced to the average of both mastoids to facilitate the identification of Middle Latency Responses (MLR) components. Fast MLR components are indicated for condition UF with corresponding scalp topographies (from standard ERPs, with original nose reference allowing for the visibility of temporal polarity inversion) at the latencies 13, 26, 36, 50, and 68 ms for P0, Na, Pa, Nb, and Pb, respectively. Right column: Grand-average ERPs corresponding to difference responses (bold lines) for condition UF and PF. Slow components, bandwidth 2–15 Hz (bottom row).
