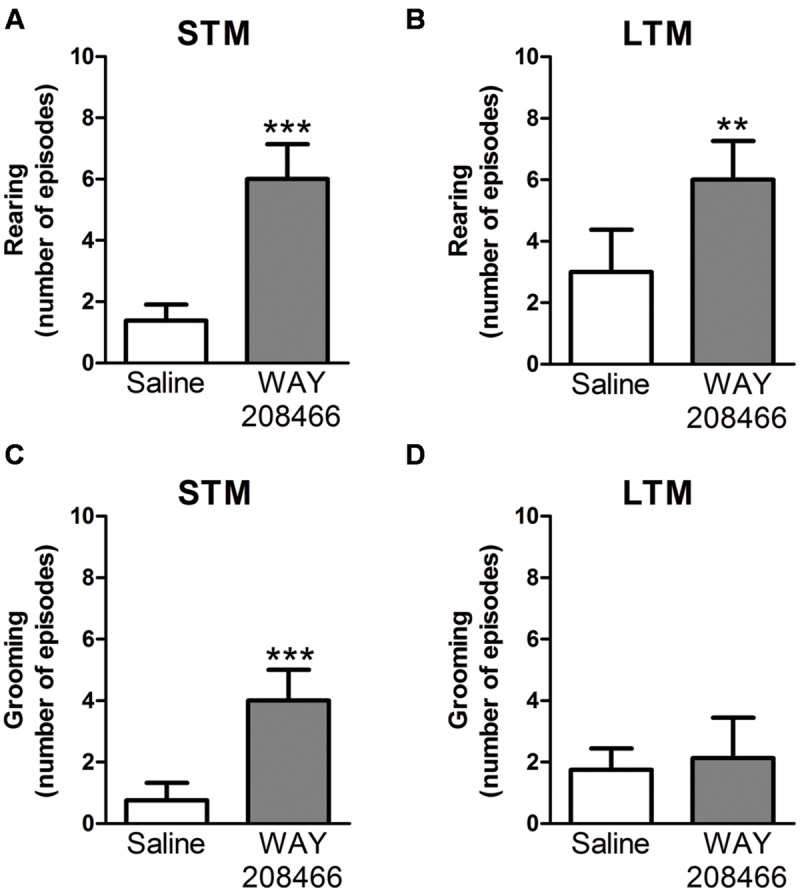
FIGURE 3.

Rearing (A,B) and grooming (C,D) during PA test. Differences in the number of rearings between treatments [saline or WAY208466 (9 mg/kg)] for STM (A) or LTM (B). Differences in the frequency of groomings between treatments [saline or WAY208466 (9 mg/kg)] for STM (C) or LTM (D). ∗∗p < 0.01; ∗∗∗p < 0.001 compared to saline group. STM, short term memory; LTM, long term memory. Mean ± SEM; n = 8 mice per group.
