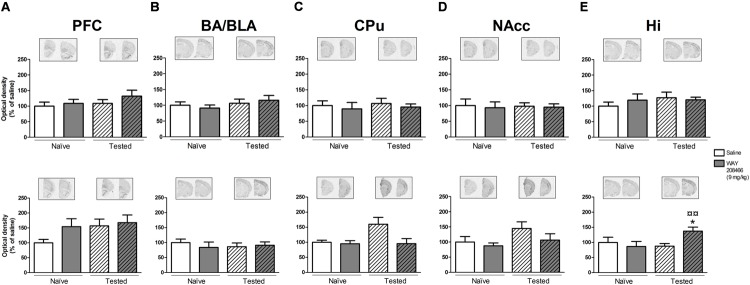
FIGURE 4.

Effects of saline and WAY208466 (9 mg/kg, ip) on the levels of c-fos mRNA after PA test for STM (upper) or LTM (lower) for (A) PFC, pre frontal cortex; (B) BA/BLA, lateral and basolateral amygdala; (C) CPu, caudate putamen; (D) NAcc, nucleus accumbens; (E) Hi, hippocampus. ∗p < 0.05 compared to saline/naïve group. ¤p < 0.05; ¤¤p < 0.01 compared to saline group. Mean ± SEM; n = 6–8 mice per group.
