Figure 3.
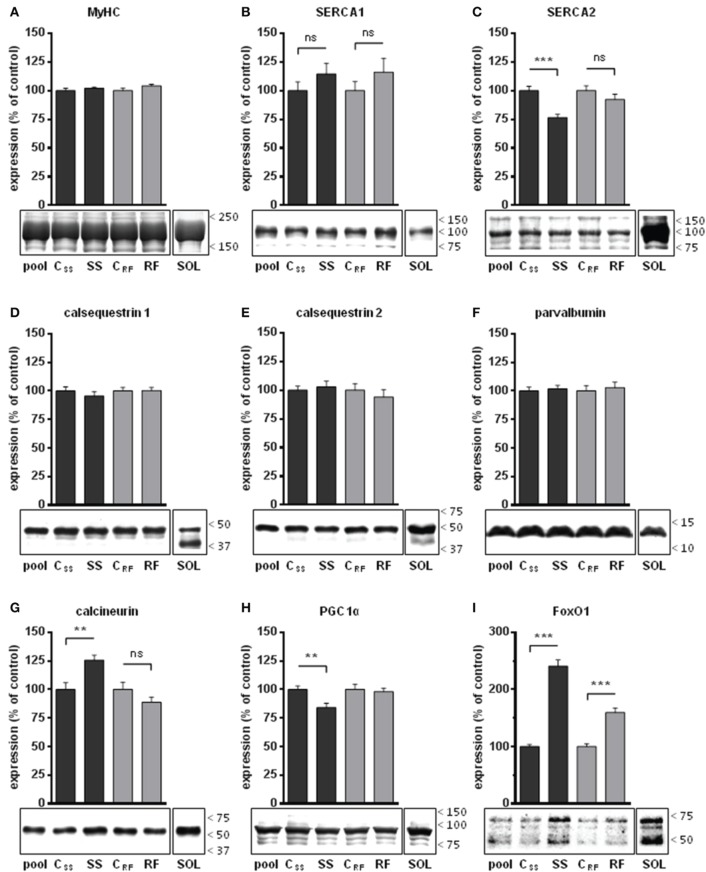
Expression levels of selected proteins in gastrocnemius extracts from semistarved and refed rats and their respective controls were determined by Western blots. (A) Amount of myosin heavy chains (MyHC) were determined by Coomassie staining in 3 independents experiments. MyHC were similarly abundant in all 4 groups and were thus validated as internal controls for the quantification of the other muscle markers under study. Selected proteins that are well known markers of Ca2+ handling in slow-twitch or fast-twitch fibers were analyzed: (B) SERCA1, (C) SERCA2, (D) calsequestrin 1, (E) calsequestrin 2, and (F) parvalbumin. The abundance of transcription factors that control the development of slow-twitch muscles either positively or negatively were also determined: (G) calcineurin, (H) PGC1-α (the most intense band at the expected size for the full-length protein was analyzed; the smaller molecular weight bands likely to be degradation products were excluded), and (I) FoxO1 (all bands, likely representing native, methylated, and acetylated forms, were quantified). The signals (B–I) were corrected for their MyHC content and normalized to the signal of a pool sample (a mixture of aliquots of all extracts) loaded on the gels for the purpose of intra-gel and inter-gel comparison. The signals from an extract of soleus muscle (a slow-twitch muscle), referred to as SOL, are shown for comparison. They were acquired under the same exposure condition as the experimental groups. The position of the molecular weight markers (kDa) is shown on the right side of the blots. SS, semistarved rats; CSS, control of semistarved rats; RF, refed rats; CRF, control of refed rats. n = 10; Mann-Whitney test; **P ≤ 0.01; ***P ≤ 0.001; ns, not significant, comparing SS or RF to their respective control.

