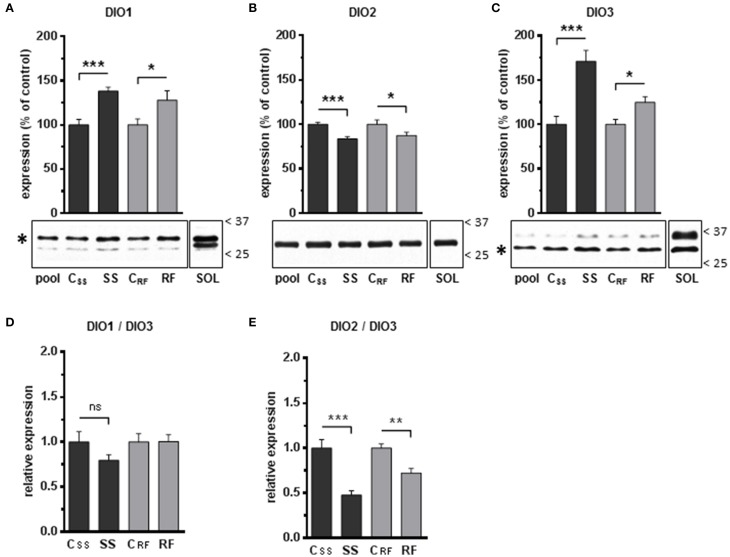
Figure 4.
Expression levels of the iodothyronine deiodinases DIO1, DIO2, and DIO3 in gastrocnemius extracts from semistarved and refed rats and their respective controls were determined by Western blots. The graphs show the expression levels of (A) DIO1, (B) DIO2, and (C) DIO3. The procedures for the normalization of the signals as well as the definition of the Pool and SOL extracts are described in the Legend to Figure 3. The position of the molecular weight markers (kDa) is shown on the right side of the blots. Asterisks indicate the bands that were identified as DIO1 and DIO3 proteins based on antibody validation experiments (see Supplementary Material for details). The faint extra bands likely represent non-specific labeling of other proteins. The ratios of DIO1-to-DIO3 (D), and DIO2-to-DIO3 (E), were calculated. SS, semistarved rats; CSS, control of semistarved rats; RF, refed rats; CRF, control of refed rats. n = 10; Mann-Whitney test; *P ≤ 0.05; **P ≤ 0.01; ***P ≤ 0.001; ns, not significant, comparing SS or RF to their respective control.

